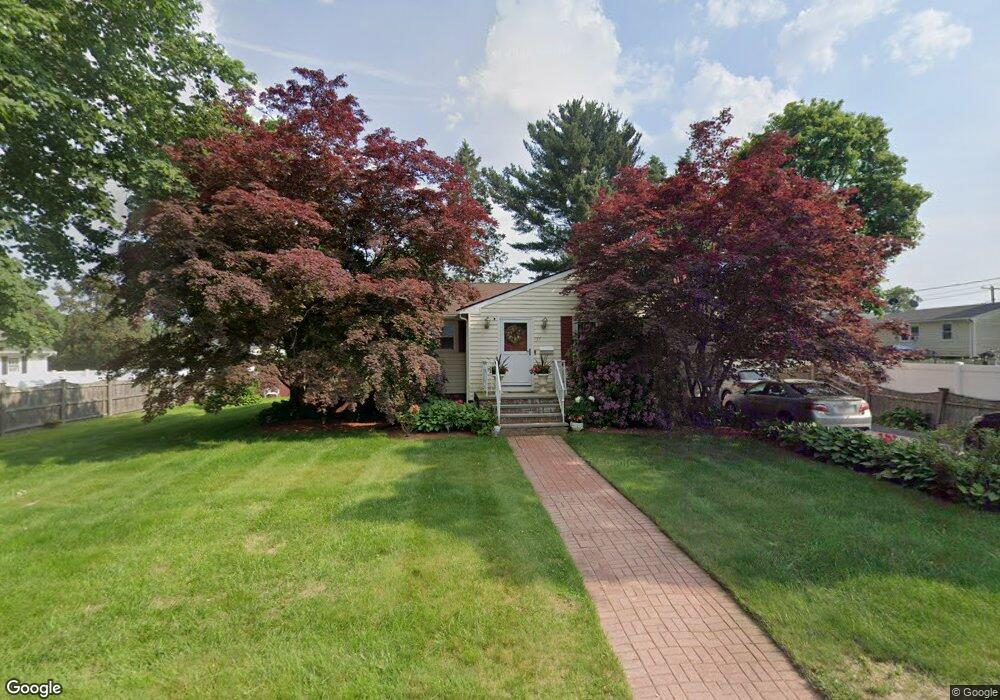
137 Litchfield St Brockton, MA 02302
Campello NeighborhoodEstimated Value: $505,142 - $535,000
3
Beds
1
Bath
1,488
Sq Ft
$350/Sq Ft
Est. Value
About This Home
This home is located at 137 Litchfield St, Brockton, MA 02302 and is currently estimated at $520,536, approximately $349 per square foot. 137 Litchfield St is a home located in Plymouth County with nearby schools including Davis K-8 School, John F. Kennedy Elementary School, and South Middle School.
Ownership History
Date
Name
Owned For
Owner Type
Purchase Details
Closed on
Sep 29, 2020
Sold by
Montinard Marie G
Bought by
Marie G Montinard Irt
Current Estimated Value
Purchase Details
Closed on
Jun 29, 1993
Sold by
Clark Michael and Clark Laurie A
Bought by
Montinard Maria G
Create a Home Valuation Report for This Property
The Home Valuation Report is an in-depth analysis detailing your home's value as well as a comparison with similar homes in the area
Home Values in the Area
Average Home Value in this Area
Purchase History
| Date | Buyer | Sale Price | Title Company |
|---|---|---|---|
| Marie G Montinard Irt | -- | None Available | |
| Montinard Maria G | $98,000 | -- |
Source: Public Records
Mortgage History
| Date | Status | Borrower | Loan Amount |
|---|---|---|---|
| Previous Owner | Montinard Maria G | $100,000 | |
| Previous Owner | Montinard Maria G | $26,000 | |
| Previous Owner | Montinard Maria G | $25,000 |
Source: Public Records
Tax History Compared to Growth
Tax History
| Year | Tax Paid | Tax Assessment Tax Assessment Total Assessment is a certain percentage of the fair market value that is determined by local assessors to be the total taxable value of land and additions on the property. | Land | Improvement |
|---|---|---|---|---|
| 2025 | $5,485 | $452,900 | $162,900 | $290,000 |
| 2024 | $5,428 | $451,600 | $162,900 | $288,700 |
| 2023 | $5,446 | $419,600 | $113,300 | $306,300 |
| 2022 | $4,888 | $349,900 | $103,000 | $246,900 |
| 2021 | $4,597 | $317,000 | $96,500 | $220,500 |
| 2020 | $4,745 | $313,200 | $84,300 | $228,900 |
| 2019 | $4,519 | $290,800 | $80,800 | $210,000 |
| 2018 | $4,102 | $255,400 | $80,800 | $174,600 |
| 2017 | $3,759 | $233,500 | $80,800 | $152,700 |
| 2016 | $3,922 | $225,900 | $77,100 | $148,800 |
| 2015 | $3,512 | $193,500 | $77,100 | $116,400 |
| 2014 | $3,341 | $184,300 | $77,100 | $107,200 |
Source: Public Records
Map
Nearby Homes