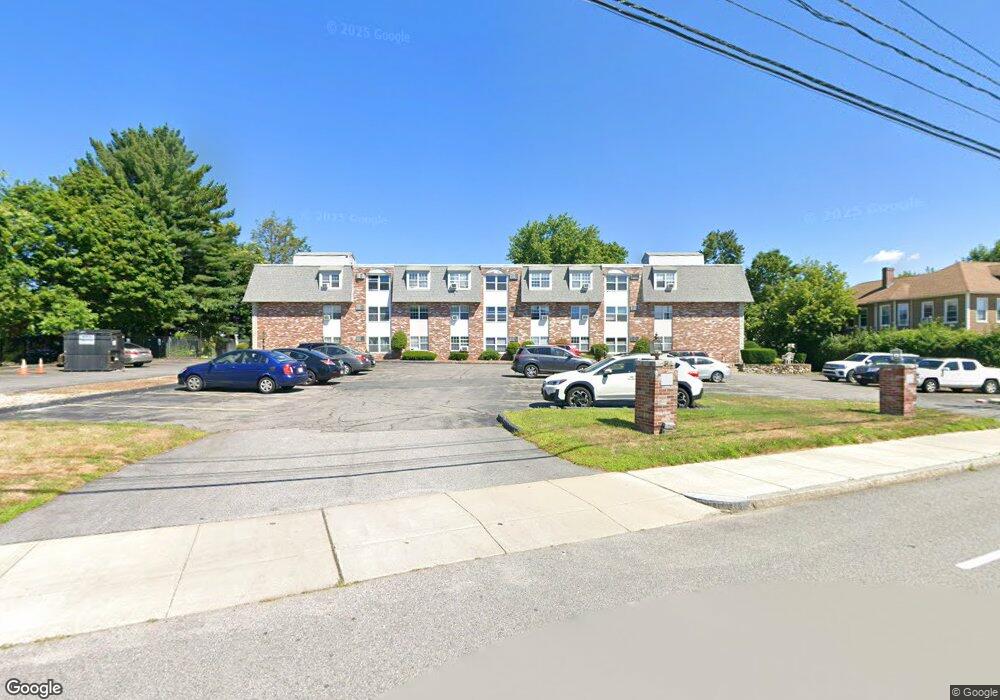
137 Pine St Unit 21 Lowell, MA 01851
Highlands NeighborhoodEstimated Value: $234,000 - $301,000
2
Beds
1
Bath
730
Sq Ft
$363/Sq Ft
Est. Value
About This Home
This home is located at 137 Pine St Unit 21, Lowell, MA 01851 and is currently estimated at $264,775, approximately $362 per square foot. 137 Pine St Unit 21 is a home located in Middlesex County with nearby schools including Charles W. Morey Elementary School, Abraham Lincoln Elementary School, and Dr. Gertrude Bailey Elementary School.
Ownership History
Date
Name
Owned For
Owner Type
Purchase Details
Closed on
Jan 2, 2001
Sold by
Robbins William J
Bought by
Connors Jay F
Current Estimated Value
Home Financials for this Owner
Home Financials are based on the most recent Mortgage that was taken out on this home.
Original Mortgage
$76,000
Outstanding Balance
$28,367
Interest Rate
7.7%
Mortgage Type
Purchase Money Mortgage
Estimated Equity
$236,408
Purchase Details
Closed on
May 19, 1998
Sold by
Lifelinks Inc
Bought by
Robbins William J
Purchase Details
Closed on
Sep 26, 1996
Sold by
Fhlmc
Bought by
Assoc Retarded Citizen
Purchase Details
Closed on
Jun 27, 1996
Sold by
Brown Richard and Brown Fhlmc
Bought by
Fhlmc
Purchase Details
Closed on
Dec 21, 1988
Sold by
Toomey Charlotte E
Bought by
Brown Richard W
Home Financials for this Owner
Home Financials are based on the most recent Mortgage that was taken out on this home.
Original Mortgage
$67,014
Interest Rate
10.18%
Mortgage Type
Purchase Money Mortgage
Create a Home Valuation Report for This Property
The Home Valuation Report is an in-depth analysis detailing your home's value as well as a comparison with similar homes in the area
Home Values in the Area
Average Home Value in this Area
Purchase History
| Date | Buyer | Sale Price | Title Company |
|---|---|---|---|
| Connors Jay F | $78,400 | -- | |
| Robbins William J | $31,250 | -- | |
| Assoc Retarded Citizen | $35,000 | -- | |
| Fhlmc | $26,000 | -- | |
| Brown Richard W | $73,000 | -- |
Source: Public Records
Mortgage History
| Date | Status | Borrower | Loan Amount |
|---|---|---|---|
| Open | Brown Richard W | $76,000 | |
| Previous Owner | Brown Richard W | $67,014 |
Source: Public Records
Tax History Compared to Growth
Tax History
| Year | Tax Paid | Tax Assessment Tax Assessment Total Assessment is a certain percentage of the fair market value that is determined by local assessors to be the total taxable value of land and additions on the property. | Land | Improvement |
|---|---|---|---|---|
| 2025 | $2,399 | $209,000 | $0 | $209,000 |
| 2024 | $2,492 | $209,200 | $0 | $209,200 |
| 2023 | $2,108 | $169,700 | $0 | $169,700 |
| 2022 | $2,081 | $164,000 | $0 | $164,000 |
| 2021 | $1,709 | $127,000 | $0 | $127,000 |
| 2020 | $1,642 | $122,900 | $0 | $122,900 |
| 2019 | $1,658 | $118,100 | $0 | $118,100 |
| 2018 | $1,406 | $97,700 | $0 | $97,700 |
| 2017 | $1,407 | $94,300 | $0 | $94,300 |
| 2016 | $1,330 | $87,700 | $0 | $87,700 |
| 2015 | $1,269 | $82,000 | $0 | $82,000 |
| 2013 | $1,046 | $69,700 | $0 | $69,700 |
Source: Public Records
Map
Nearby Homes
- 137 Pine St
- 137 Pine St Unit 29
- 137 Pine St Unit 9
- 137 Pine St Unit 27
- 137 Pine St Unit 17
- 137 Pine St Unit 26
- 137 Pine St Unit 28
- 137 Pine St Unit 5
- 137 Pine St Unit 6
- 137 Pine St Unit 7
- 137 Pine St Unit 22
- 137 Pine St Unit 24
- 137 Pine St Unit 11
- 137 Pine St Unit 18
- 137 Pine St Unit 10
- 137 Pine St Unit 19
- 137 Pine St Unit 3
- 137 Pine St Unit 16
- 137 Pine St Unit 1
- 137 Pine St Unit 2