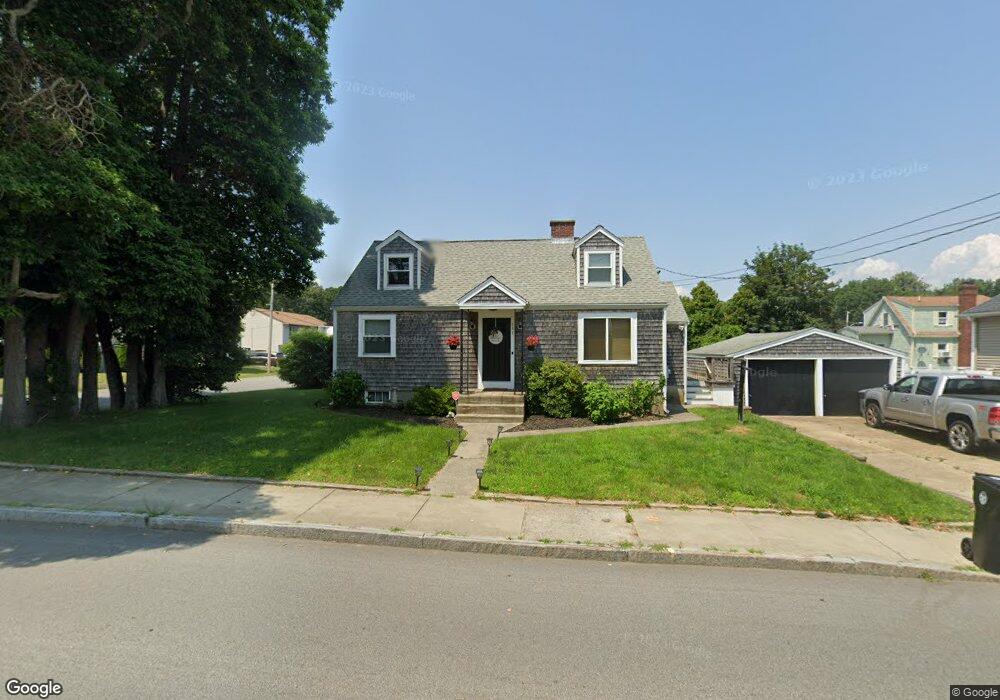
137 Sharp St North Dartmouth, MA 02747
Bliss Corner NeighborhoodEstimated Value: $461,866 - $515,000
4
Beds
2
Baths
1,489
Sq Ft
$327/Sq Ft
Est. Value
About This Home
This home is located at 137 Sharp St, North Dartmouth, MA 02747 and is currently estimated at $486,467, approximately $326 per square foot. 137 Sharp St is a home located in Bristol County with nearby schools including Dartmouth High School, St. Teresa of Calcutta School, and Our Sister's School.
Ownership History
Date
Name
Owned For
Owner Type
Purchase Details
Closed on
Jan 15, 2016
Sold by
Carvalho Curtiss J and Carvalho Michelle J
Bought by
Carvalho Jaime A
Current Estimated Value
Home Financials for this Owner
Home Financials are based on the most recent Mortgage that was taken out on this home.
Original Mortgage
$270,019
Outstanding Balance
$214,822
Interest Rate
3.97%
Mortgage Type
FHA
Estimated Equity
$271,645
Create a Home Valuation Report for This Property
The Home Valuation Report is an in-depth analysis detailing your home's value as well as a comparison with similar homes in the area
Home Values in the Area
Average Home Value in this Area
Purchase History
| Date | Buyer | Sale Price | Title Company |
|---|---|---|---|
| Carvalho Jaime A | $275,000 | -- |
Source: Public Records
Mortgage History
| Date | Status | Borrower | Loan Amount |
|---|---|---|---|
| Open | Carvalho Jaime A | $270,019 |
Source: Public Records
Tax History Compared to Growth
Tax History
| Year | Tax Paid | Tax Assessment Tax Assessment Total Assessment is a certain percentage of the fair market value that is determined by local assessors to be the total taxable value of land and additions on the property. | Land | Improvement |
|---|---|---|---|---|
| 2025 | $2,739 | $318,100 | $112,300 | $205,800 |
| 2024 | $2,679 | $308,300 | $106,000 | $202,300 |
| 2023 | $2,689 | $293,200 | $106,000 | $187,200 |
| 2022 | $2,662 | $268,900 | $106,000 | $162,900 |
| 2021 | $2,285 | $220,600 | $90,800 | $129,800 |
| 2020 | $2,296 | $221,200 | $100,500 | $120,700 |
| 2019 | $2,503 | $240,700 | $121,100 | $119,600 |
| 2018 | $2,418 | $225,900 | $121,100 | $104,800 |
| 2017 | $2,161 | $215,700 | $114,200 | $101,500 |
| 2016 | $2,186 | $215,200 | $114,200 | $101,000 |
| 2015 | $2,121 | $209,200 | $106,700 | $102,500 |
| 2014 | $2,139 | $209,500 | $96,800 | $112,700 |
Source: Public Records
Map
Nearby Homes