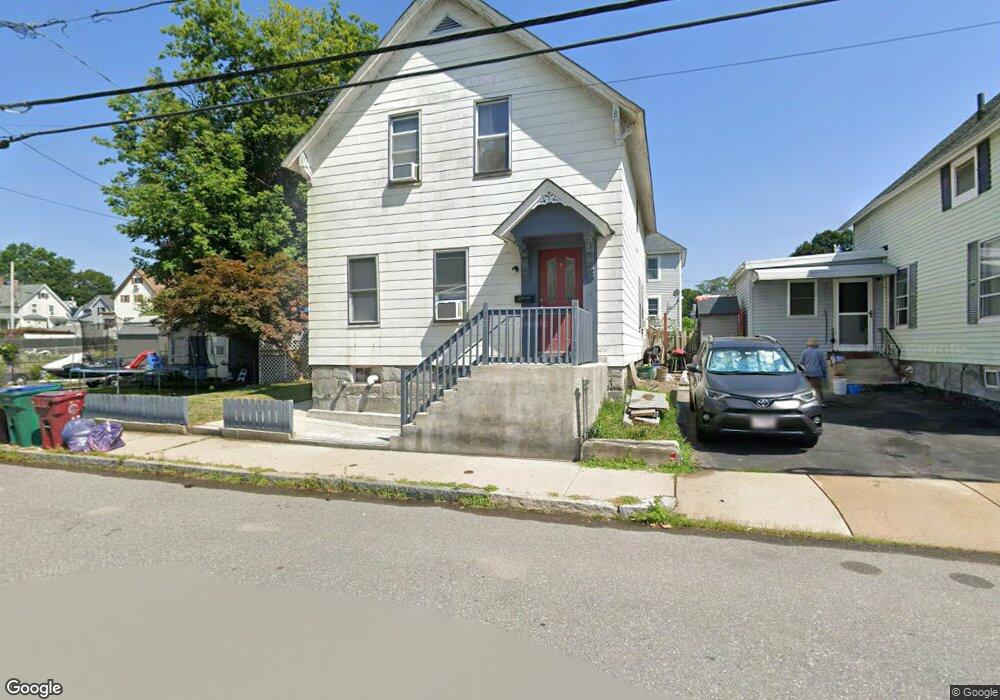
137 Shaw St Lowell, MA 01851
Lower Highlands NeighborhoodEstimated Value: $401,000 - $470,000
3
Beds
2
Baths
1,443
Sq Ft
$301/Sq Ft
Est. Value
About This Home
This home is located at 137 Shaw St, Lowell, MA 01851 and is currently estimated at $434,405, approximately $301 per square foot. 137 Shaw St is a home located in Middlesex County with nearby schools including Abraham Lincoln Elementary School, Charles W. Morey Elementary School, and Dr. Gertrude Bailey Elementary School.
Ownership History
Date
Name
Owned For
Owner Type
Purchase Details
Closed on
Aug 30, 2019
Sold by
Tanguay Robin L
Bought by
58 Agawam Street Llc
Current Estimated Value
Purchase Details
Closed on
Jun 5, 2002
Sold by
Quebec Henry A
Bought by
Tanguay Robin L
Home Financials for this Owner
Home Financials are based on the most recent Mortgage that was taken out on this home.
Original Mortgage
$81,600
Interest Rate
6.9%
Mortgage Type
Purchase Money Mortgage
Purchase Details
Closed on
Feb 26, 1993
Sold by
Stpierre Jean M and Baroni Mary K
Bought by
Quebec Henry A and Quebec Mary L
Home Financials for this Owner
Home Financials are based on the most recent Mortgage that was taken out on this home.
Original Mortgage
$62,000
Interest Rate
8.03%
Mortgage Type
Purchase Money Mortgage
Create a Home Valuation Report for This Property
The Home Valuation Report is an in-depth analysis detailing your home's value as well as a comparison with similar homes in the area
Home Values in the Area
Average Home Value in this Area
Purchase History
| Date | Buyer | Sale Price | Title Company |
|---|---|---|---|
| 58 Agawam Street Llc | $122,000 | -- | |
| Tanguay Robin L | $102,000 | -- | |
| Tanguay Robin L | $102,000 | -- | |
| Quebec Henry A | $72,000 | -- | |
| Quebec Henry A | $72,000 | -- |
Source: Public Records
Mortgage History
| Date | Status | Borrower | Loan Amount |
|---|---|---|---|
| Previous Owner | Quebec Henry A | $81,600 | |
| Previous Owner | Quebec Henry A | $62,000 |
Source: Public Records
Tax History
| Year | Tax Paid | Tax Assessment Tax Assessment Total Assessment is a certain percentage of the fair market value that is determined by local assessors to be the total taxable value of land and additions on the property. | Land | Improvement |
|---|---|---|---|---|
| 2025 | $4,241 | $369,400 | $138,200 | $231,200 |
| 2024 | $4,078 | $342,400 | $124,300 | $218,100 |
| 2023 | $3,835 | $308,800 | $108,100 | $200,700 |
| 2022 | $3,537 | $278,700 | $98,300 | $180,400 |
| 2021 | $3,298 | $245,000 | $85,500 | $159,500 |
| 2020 | $3,022 | $226,200 | $74,700 | $151,500 |
| 2019 | $2,784 | $198,300 | $69,100 | $129,200 |
| 2018 | $2,633 | $186,300 | $62,900 | $123,400 |
| 2017 | $2,595 | $173,900 | $57,200 | $116,700 |
| 2016 | $2,853 | $188,200 | $54,500 | $133,700 |
| 2015 | $2,779 | $179,500 | $55,700 | $123,800 |
| 2013 | $2,631 | $175,300 | $66,700 | $108,600 |
Source: Public Records
Map
Nearby Homes
Your Personal Tour Guide
Ask me questions while you tour the home.