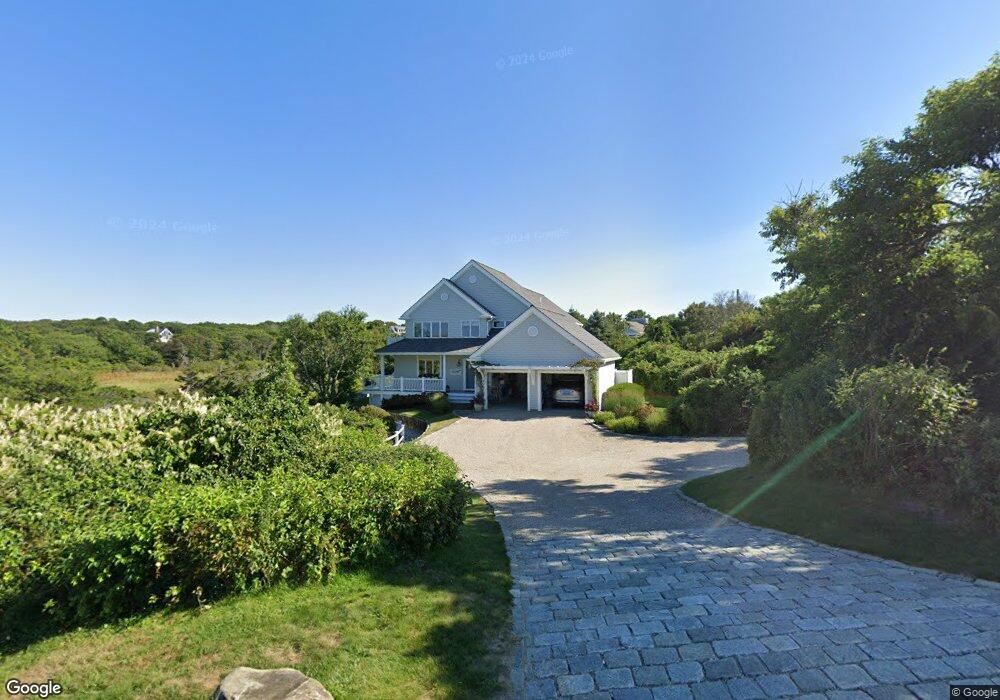
137 Shore Dr Dennis, MA 02638
Dennis Village NeighborhoodEstimated Value: $1,962,000 - $3,302,000
4
Beds
3
Baths
2,201
Sq Ft
$1,247/Sq Ft
Est. Value
About This Home
This home is located at 137 Shore Dr, Dennis, MA 02638 and is currently estimated at $2,744,733, approximately $1,247 per square foot. 137 Shore Dr is a home located in Barnstable County with nearby schools including Dennis-Yarmouth Regional High School.
Ownership History
Date
Name
Owned For
Owner Type
Purchase Details
Closed on
Sep 13, 2002
Sold by
Constanzo Carmella A and Constanzo Robert A
Bought by
Salt Air Rt and Cummings
Current Estimated Value
Home Financials for this Owner
Home Financials are based on the most recent Mortgage that was taken out on this home.
Original Mortgage
$115,000
Outstanding Balance
$48,880
Interest Rate
6.48%
Mortgage Type
Purchase Money Mortgage
Estimated Equity
$2,695,853
Purchase Details
Closed on
May 15, 1997
Sold by
Buthman Roy W and Buthman Doris L
Bought by
Becker Robert and Becker Patricia M
Home Financials for this Owner
Home Financials are based on the most recent Mortgage that was taken out on this home.
Original Mortgage
$367,500
Interest Rate
8.12%
Mortgage Type
Purchase Money Mortgage
Purchase Details
Closed on
Feb 13, 1995
Sold by
Sabatelli Angela M
Bought by
C & B Dev Inc
Home Financials for this Owner
Home Financials are based on the most recent Mortgage that was taken out on this home.
Original Mortgage
$341,600
Interest Rate
9.18%
Mortgage Type
Purchase Money Mortgage
Create a Home Valuation Report for This Property
The Home Valuation Report is an in-depth analysis detailing your home's value as well as a comparison with similar homes in the area
Home Values in the Area
Average Home Value in this Area
Purchase History
| Date | Buyer | Sale Price | Title Company |
|---|---|---|---|
| Salt Air Rt | $225,301 | -- | |
| Becker Robert | $487,500 | -- | |
| C & B Dev Inc | $180,000 | -- |
Source: Public Records
Mortgage History
| Date | Status | Borrower | Loan Amount |
|---|---|---|---|
| Open | Salt Air Rt | $115,000 | |
| Previous Owner | Becker Robert | $367,500 | |
| Previous Owner | C & B Dev Inc | $341,600 |
Source: Public Records
Tax History Compared to Growth
Tax History
| Year | Tax Paid | Tax Assessment Tax Assessment Total Assessment is a certain percentage of the fair market value that is determined by local assessors to be the total taxable value of land and additions on the property. | Land | Improvement |
|---|---|---|---|---|
| 2025 | $10,864 | $2,508,900 | $1,441,200 | $1,067,700 |
| 2024 | $10,822 | $2,465,200 | $1,386,000 | $1,079,200 |
| 2023 | $10,513 | $2,251,200 | $1,259,900 | $991,300 |
| 2022 | $9,811 | $1,752,000 | $1,071,900 | $680,100 |
| 2021 | $9,142 | $1,516,100 | $927,200 | $588,900 |
| 2020 | $9,077 | $1,488,000 | $927,200 | $560,800 |
| 2019 | $8,868 | $1,437,300 | $909,100 | $528,200 |
| 2018 | $8,826 | $1,392,100 | $865,400 | $526,700 |
| 2017 | $8,283 | $1,346,900 | $761,600 | $585,300 |
| 2016 | $7,742 | $1,185,600 | $703,900 | $481,700 |
| 2015 | $7,331 | $1,145,500 | $703,900 | $441,600 |
| 2014 | $7,160 | $1,127,600 | $703,900 | $423,700 |
Source: Public Records
Map
Nearby Homes
- 156 Shore Dr
- 96 Shore Dr
- 12 Dunes View Rd
- 25 Horsefoot Path
- 69 Horsefoot Path
- 94 Horsefoot Path
- 37 Johnson Ln
- 7 Dolphin Way
- 7 Collins Ave
- 73 Pilgrim Rd
- 49 Rodoalph's Way
- 4 Spadoni Rd
- 4 Spadoni Way
- 19 Whig St
- 59 Hope Ln
- 19 Deacon Joseph Ln
- 645 Main St Back Lot
- 831 Main St
- 15 Signal Hill Dr
- 6 Thomas Ct
- 133 Shore Dr
- 147 Shore Dr
- 140 Shore Dr
- 136 Shore Dr
- 146 Shore Dr
- 62 E Bay View Rd
- 64 E Bay View Rd
- 64 E Bay View Rd Unit 1
- 62 E Bay View Rd Unit 2
- 62 E Bay View Rd Unit 1
- 153 Shore Dr
- 150 Shore Dr
- 16 Jonathan Dr
- 54 E Bay View Rd
- 130 Shore Dr
- 134 Shore Dr
- 123 Shore Dr
- 123 Shore Rd
- 68 E Bay View Rd
- 65 E Bay View Rd