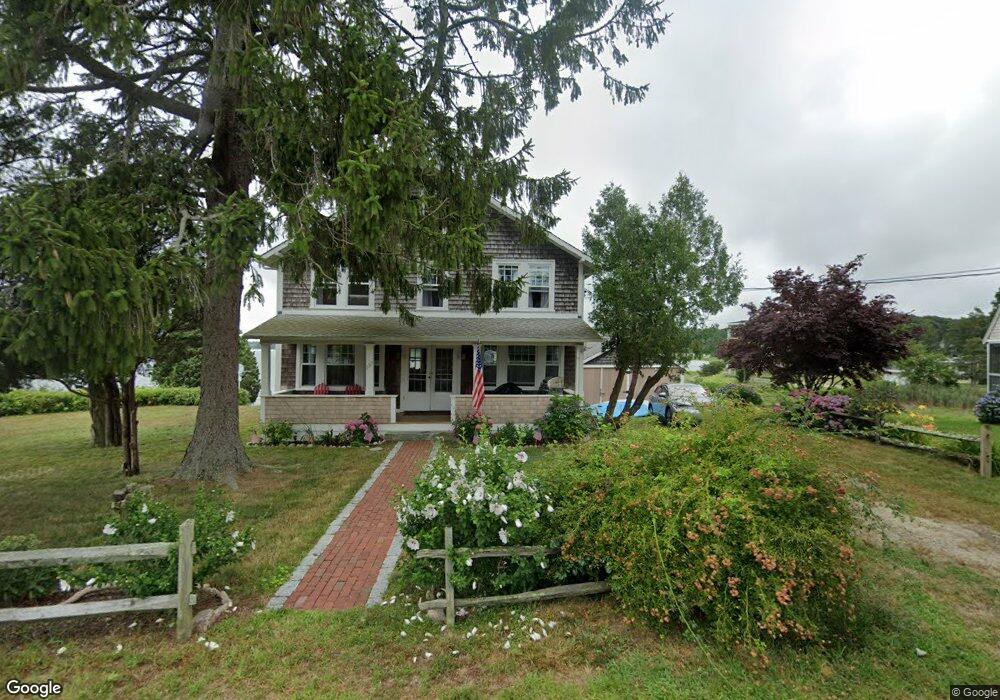
137 Tahanto Rd Pocasset, MA 02559
Pocasset NeighborhoodEstimated Value: $1,142,000 - $1,334,000
4
Beds
2
Baths
2,542
Sq Ft
$487/Sq Ft
Est. Value
About This Home
This home is located at 137 Tahanto Rd, Pocasset, MA 02559 and is currently estimated at $1,238,123, approximately $487 per square foot. 137 Tahanto Rd is a home located in Barnstable County with nearby schools including Bourne High School, Cadence Academy Preschool - Bourne, and St Margaret Regional School.
Ownership History
Date
Name
Owned For
Owner Type
Purchase Details
Closed on
May 15, 2017
Sold by
Tobey Island T and Bourassa
Bought by
Bourassa Craig D
Current Estimated Value
Home Financials for this Owner
Home Financials are based on the most recent Mortgage that was taken out on this home.
Original Mortgage
$500,000
Outstanding Balance
$414,281
Interest Rate
4.14%
Mortgage Type
Purchase Money Mortgage
Estimated Equity
$823,842
Create a Home Valuation Report for This Property
The Home Valuation Report is an in-depth analysis detailing your home's value as well as a comparison with similar homes in the area
Home Values in the Area
Average Home Value in this Area
Purchase History
| Date | Buyer | Sale Price | Title Company |
|---|---|---|---|
| Bourassa Craig D | $700,000 | -- | |
| Bourassa Craig D | $700,000 | -- |
Source: Public Records
Mortgage History
| Date | Status | Borrower | Loan Amount |
|---|---|---|---|
| Open | Bourassa Craig D | $500,000 | |
| Closed | Bourassa Craig D | $500,000 |
Source: Public Records
Tax History Compared to Growth
Tax History
| Year | Tax Paid | Tax Assessment Tax Assessment Total Assessment is a certain percentage of the fair market value that is determined by local assessors to be the total taxable value of land and additions on the property. | Land | Improvement |
|---|---|---|---|---|
| 2025 | $8,413 | $1,077,200 | $690,700 | $386,500 |
| 2024 | $8,227 | $1,025,800 | $657,800 | $368,000 |
| 2023 | $7,855 | $891,600 | $582,200 | $309,400 |
| 2022 | $7,675 | $760,700 | $515,200 | $245,500 |
| 2021 | $6,952 | $645,500 | $422,000 | $223,500 |
| 2020 | $6,809 | $634,000 | $418,000 | $216,000 |
| 2019 | $7,145 | $679,800 | $464,400 | $215,400 |
| 2018 | $6,202 | $588,400 | $442,400 | $146,000 |
| 2017 | $6,002 | $582,700 | $438,200 | $144,500 |
| 2016 | $5,557 | $546,900 | $438,200 | $108,700 |
| 2015 | $4,627 | $459,500 | $306,700 | $152,800 |
Source: Public Records
Map
Nearby Homes