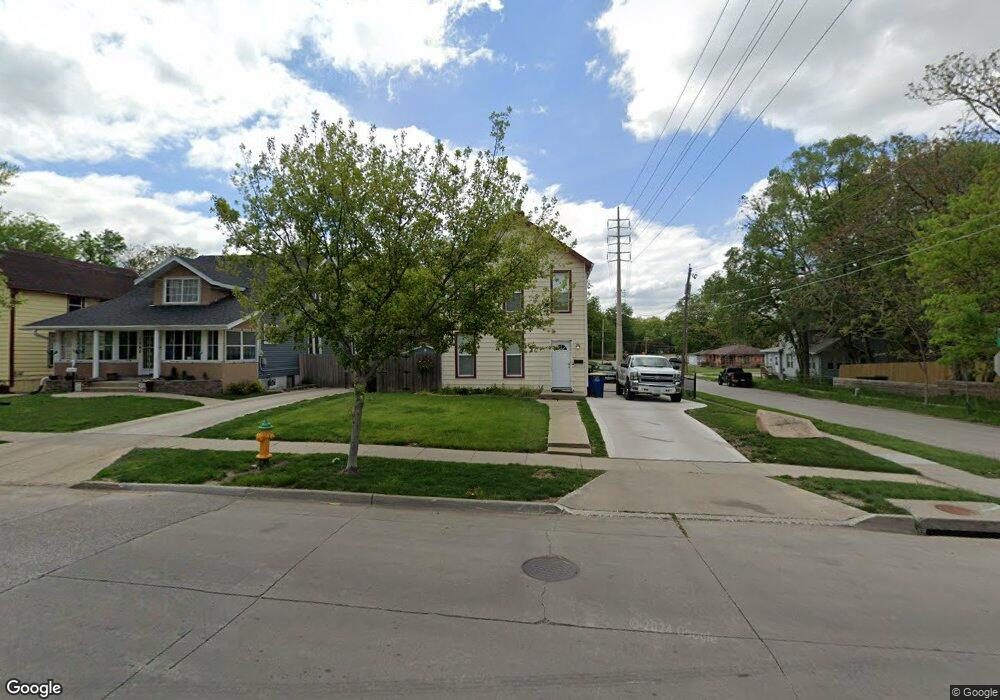
1370 E 9th St Des Moines, IA 50316
Capitol Park NeighborhoodEstimated Value: $152,914 - $188,000
4
Beds
2
Baths
1,920
Sq Ft
$89/Sq Ft
Est. Value
About This Home
This home is located at 1370 E 9th St, Des Moines, IA 50316 and is currently estimated at $170,457, approximately $88 per square foot. 1370 E 9th St is a home located in Polk County with nearby schools including Carver Elementary School, Hiatt Middle School, and East High School.
Ownership History
Date
Name
Owned For
Owner Type
Purchase Details
Closed on
Feb 22, 2010
Sold by
Murillo Maria L and Soriano Maria L
Bought by
Soriano Maria L and Murillo Maria L
Current Estimated Value
Purchase Details
Closed on
Sep 19, 2008
Sold by
Murillo Ramon F
Bought by
Alvarado Guzman Marco A
Home Financials for this Owner
Home Financials are based on the most recent Mortgage that was taken out on this home.
Original Mortgage
$79,852
Outstanding Balance
$52,972
Interest Rate
6.55%
Mortgage Type
FHA
Estimated Equity
$117,485
Purchase Details
Closed on
Sep 19, 2007
Sold by
Murillo Maria L
Bought by
Murillo Ramon F
Purchase Details
Closed on
Apr 24, 2002
Sold by
Taylor Doris A
Bought by
Murillo Ramon F and Murillo Maria L
Home Financials for this Owner
Home Financials are based on the most recent Mortgage that was taken out on this home.
Original Mortgage
$57,950
Interest Rate
5.62%
Mortgage Type
Commercial
Create a Home Valuation Report for This Property
The Home Valuation Report is an in-depth analysis detailing your home's value as well as a comparison with similar homes in the area
Home Values in the Area
Average Home Value in this Area
Purchase History
| Date | Buyer | Sale Price | Title Company |
|---|---|---|---|
| Soriano Maria L | -- | None Available | |
| Alvarado Guzman Marco A | $80,500 | None Available | |
| Murillo Ramon F | -- | None Available | |
| Murillo Ramon F | $60,500 | -- |
Source: Public Records
Mortgage History
| Date | Status | Borrower | Loan Amount |
|---|---|---|---|
| Open | Alvarado Guzman Marco A | $79,852 | |
| Previous Owner | Murillo Ramon F | $57,950 |
Source: Public Records
Tax History
| Year | Tax Paid | Tax Assessment Tax Assessment Total Assessment is a certain percentage of the fair market value that is determined by local assessors to be the total taxable value of land and additions on the property. | Land | Improvement |
|---|---|---|---|---|
| 2025 | $2,822 | $162,300 | $31,900 | $130,400 |
| 2024 | $2,822 | $143,500 | $28,200 | $115,300 |
| 2023 | $2,950 | $143,500 | $28,200 | $115,300 |
| 2022 | $2,928 | $125,200 | $25,600 | $99,600 |
| 2021 | $2,742 | $125,200 | $25,600 | $99,600 |
| 2020 | $2,850 | $109,900 | $22,700 | $87,200 |
| 2019 | $2,778 | $109,900 | $22,700 | $87,200 |
| 2018 | $2,570 | $96,600 | $19,500 | $77,100 |
| 2017 | $2,472 | $96,600 | $19,500 | $77,100 |
| 2016 | $2,408 | $91,400 | $18,300 | $73,100 |
| 2015 | $2,408 | $91,400 | $18,300 | $73,100 |
| 2014 | $2,142 | $80,600 | $16,100 | $64,500 |
Source: Public Records
Map
Nearby Homes
- 1418 E 9th St
- 1352 E 12th St
- 1372 E 12th St
- 1349 E 12th St
- 810 E Washington Ave
- 1614 E 13th St
- 1613 York St
- 1416 Cleveland Ave
- 1415 Osceola Ave
- 1018 E 12th St
- 1801 York St
- 1019 E 8th St
- 1353 E 15th St
- 1803 E 14th St
- 1501 Osceola Ave
- 1816 E 14th St
- 917 E 12th St
- 1916 York St
- 1400 Mattern Ave
- 2015 York St
- 1368 E 9th St
- 1364 E 9th St
- 821 Cleveland Ave
- 836 Cleveland Ave
- 836 Cleveland Ave Unit A
- 1360 E 9th St
- 1406 E 9th St
- 819 Cleveland Ave
- 1356 E 9th St
- 1373 E 9th St
- 1371 E 9th St
- 1367 E 9th St
- 817 Cleveland Ave
- 1354 E 9th St
- 902 Cleveland Ave
- 1363 E 9th St
- 1359 E 9th St
- 904 Cleveland Ave
- 1350 E 9th St
- 808 Cleveland Ave
Your Personal Tour Guide
Ask me questions while you tour the home.