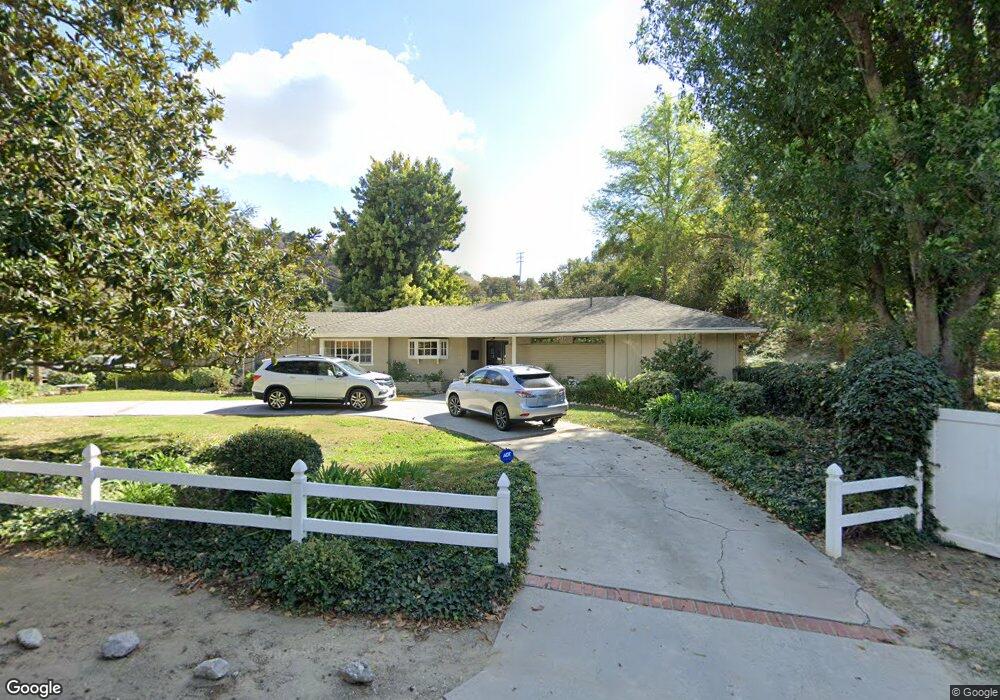
1370 East Rd La Habra Heights, CA 90631
Estimated Value: $1,235,000 - $1,632,000
4
Beds
3
Baths
2,602
Sq Ft
$562/Sq Ft
Est. Value
About This Home
This home is located at 1370 East Rd, La Habra Heights, CA 90631 and is currently estimated at $1,462,488, approximately $562 per square foot. 1370 East Rd is a home located in Los Angeles County with nearby schools including El Portal Elementary School, Rancho-Starbuck Intermediate School, and Sonora High School.
Ownership History
Date
Name
Owned For
Owner Type
Purchase Details
Closed on
Jul 20, 2018
Sold by
Vigliotti Jerry and Vigliotti Marianne
Bought by
Vigliotti Jerry Wayne and Vigliotti Marianne Stratico
Current Estimated Value
Purchase Details
Closed on
Sep 10, 2003
Sold by
Johnson Maile R and Dodd Ryan E
Bought by
Vigliotti Jerry and Vigliotti Marianne
Home Financials for this Owner
Home Financials are based on the most recent Mortgage that was taken out on this home.
Original Mortgage
$624,000
Interest Rate
5.5%
Mortgage Type
Purchase Money Mortgage
Purchase Details
Closed on
Jun 4, 2001
Sold by
Johnson Kurt
Bought by
Johnson Maile R
Purchase Details
Closed on
May 11, 2001
Sold by
Dodd Lynda Marie
Bought by
Johnson Maile R and Dodd Ryan E
Purchase Details
Closed on
Jan 12, 1995
Sold by
Dodd William Eugene and Dodd Lynda Marie
Bought by
Dodd Lynda Marie
Create a Home Valuation Report for This Property
The Home Valuation Report is an in-depth analysis detailing your home's value as well as a comparison with similar homes in the area
Home Values in the Area
Average Home Value in this Area
Purchase History
| Date | Buyer | Sale Price | Title Company |
|---|---|---|---|
| Vigliotti Jerry Wayne | -- | None Available | |
| Vigliotti Jerry | $780,000 | Fidelity National Title Co | |
| Johnson Maile R | -- | -- | |
| Johnson Maile R | -- | -- | |
| Dodd Lynda Marie | -- | -- |
Source: Public Records
Mortgage History
| Date | Status | Borrower | Loan Amount |
|---|---|---|---|
| Previous Owner | Vigliotti Jerry | $624,000 | |
| Closed | Vigliotti Jerry | $40,000 |
Source: Public Records
Tax History Compared to Growth
Tax History
| Year | Tax Paid | Tax Assessment Tax Assessment Total Assessment is a certain percentage of the fair market value that is determined by local assessors to be the total taxable value of land and additions on the property. | Land | Improvement |
|---|---|---|---|---|
| 2025 | $12,953 | $1,108,979 | $651,172 | $457,807 |
| 2024 | $12,953 | $1,087,235 | $638,404 | $448,831 |
| 2023 | $12,659 | $1,065,918 | $625,887 | $440,031 |
| 2022 | $12,528 | $1,045,018 | $613,615 | $431,403 |
| 2021 | $12,256 | $1,024,529 | $601,584 | $422,945 |
| 2019 | $11,921 | $994,143 | $583,742 | $410,401 |
| 2018 | $11,288 | $974,651 | $572,297 | $402,354 |
| 2016 | $10,604 | $936,806 | $550,075 | $386,731 |
| 2015 | $10,184 | $922,735 | $541,813 | $380,922 |
| 2014 | $10,153 | $904,661 | $531,200 | $373,461 |
Source: Public Records
Map
Nearby Homes
- 1929 Coban Rd
- 2240 Valle Dr
- 0 Airoso Rd
- 1573 Nabal Rd
- 1500 Kashlan Rd
- 918 Dorothea Rd
- 927 E Avocado Crest Rd
- 918 Reposado Dr
- 1445 Darlene Dr
- 739 Reposado Dr
- 18109 Graystone Way
- 1241 Arbolita Dr
- 1944 Chandos Ln
- 506 Dorothea Rd
- 161 W Hidden Ln
- 220 Olinda Ave
- 171 Canada Sombre Rd
- 105 Reposado Dr
- 1100 N Euclid St
- 0 Ardsheal Dr Unit PW23063710