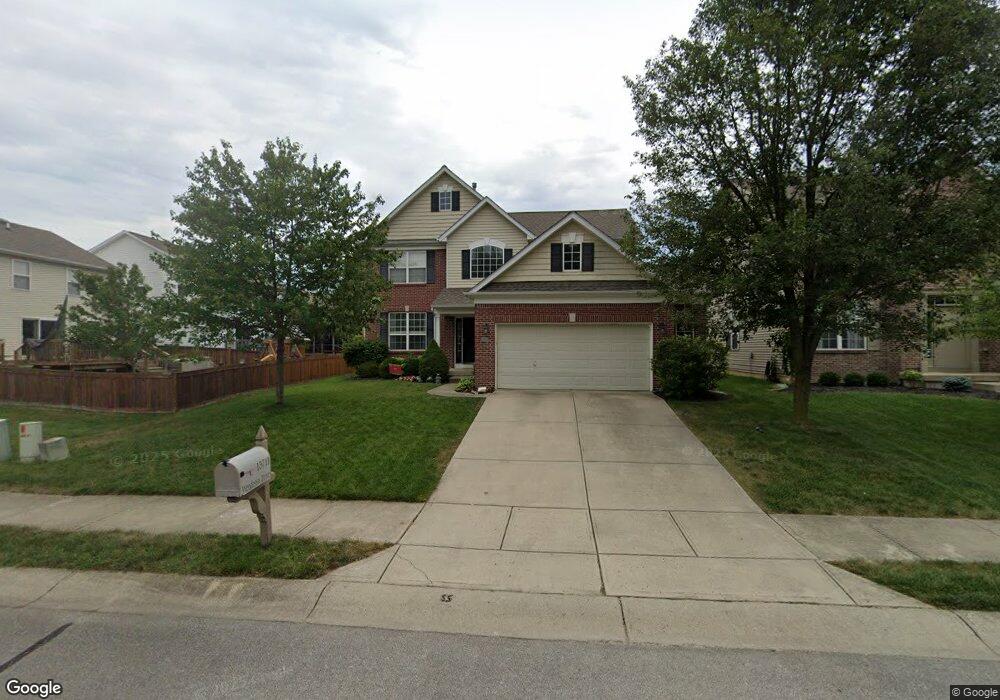
13711 Wendessa Dr Fishers, IN 46038
Estimated Value: $397,000 - $423,580
4
Beds
3
Baths
3,942
Sq Ft
$105/Sq Ft
Est. Value
About This Home
This home is located at 13711 Wendessa Dr, Fishers, IN 46038 and is currently estimated at $414,395, approximately $105 per square foot. 13711 Wendessa Dr is a home located in Hamilton County with nearby schools including Sand Creek Elementary School, Sand Creek Intermediate School, and Fishers Junior High School.
Ownership History
Date
Name
Owned For
Owner Type
Purchase Details
Closed on
Feb 2, 2024
Sold by
Potter Ryan T and Potter Sara K
Bought by
Potter Sara K
Current Estimated Value
Purchase Details
Closed on
Feb 1, 2024
Sold by
Potter Ryan T and Potter Sara K
Bought by
Potter Sara K
Purchase Details
Closed on
Aug 28, 2007
Sold by
Bergmann Florian R and Fleming Kathleen Ann
Bought by
Potter Ryan T and Potter Sara K
Home Financials for this Owner
Home Financials are based on the most recent Mortgage that was taken out on this home.
Original Mortgage
$207,000
Interest Rate
6.71%
Mortgage Type
Purchase Money Mortgage
Purchase Details
Closed on
Jun 27, 2006
Sold by
Rh Of Indiana Lp
Bought by
Bergmann Florian R and Fleming Kathleen Ann
Home Financials for this Owner
Home Financials are based on the most recent Mortgage that was taken out on this home.
Original Mortgage
$187,536
Interest Rate
6.68%
Mortgage Type
Purchase Money Mortgage
Purchase Details
Closed on
Nov 17, 2005
Sold by
Boomerang Development Llc
Bought by
Rh Of Indiana Lp
Create a Home Valuation Report for This Property
The Home Valuation Report is an in-depth analysis detailing your home's value as well as a comparison with similar homes in the area
Home Values in the Area
Average Home Value in this Area
Purchase History
| Date | Buyer | Sale Price | Title Company |
|---|---|---|---|
| Potter Sara K | -- | None Listed On Document | |
| Potter Sara K | -- | None Listed On Document | |
| Potter Ryan T | -- | None Available | |
| Bergmann Florian R | -- | None Available | |
| Rh Of Indiana Lp | -- | -- |
Source: Public Records
Mortgage History
| Date | Status | Borrower | Loan Amount |
|---|---|---|---|
| Previous Owner | Potter Ryan T | $207,000 | |
| Previous Owner | Bergmann Florian R | $187,536 |
Source: Public Records
Tax History Compared to Growth
Tax History
| Year | Tax Paid | Tax Assessment Tax Assessment Total Assessment is a certain percentage of the fair market value that is determined by local assessors to be the total taxable value of land and additions on the property. | Land | Improvement |
|---|---|---|---|---|
| 2024 | $3,722 | $346,900 | $56,600 | $290,300 |
| 2023 | $3,722 | $334,300 | $56,600 | $277,700 |
| 2022 | $3,630 | $303,200 | $56,600 | $246,600 |
| 2021 | $3,132 | $262,900 | $56,600 | $206,300 |
| 2020 | $2,979 | $246,800 | $56,600 | $190,200 |
| 2019 | $2,962 | $245,400 | $49,600 | $195,800 |
| 2018 | $2,805 | $232,200 | $49,600 | $182,600 |
| 2017 | $2,731 | $229,700 | $49,600 | $180,100 |
| 2016 | $2,617 | $225,000 | $49,600 | $175,400 |
| 2014 | $2,162 | $205,500 | $49,600 | $155,900 |
| 2013 | $2,162 | $201,900 | $49,600 | $152,300 |
Source: Public Records
Map
Nearby Homes
- 13855 Boulder Canyon Dr
- 11581 Beardsley Way
- 13703 Van Buren Place
- 13410 White Granite Dr Unit 1100
- 13415 White Granite Dr Unit 600
- 14231 Coyote Ridge Dr
- 14234 Coyote Ridge Dr
- The Pendula Plan at Marilyn Woods - The Signature Collection
- The Holbrook Plan at Marilyn Woods - The Courtyard Collection
- The Landram Plan at Marilyn Woods - The Classic Collection
- The Hoosier Plan at Marilyn Woods - The Signature Collection
- The Ditney Plan at Marilyn Woods - The Classic Collection
- 14247 Coyote Ridge Dr Unit 37598111
- The Crestline Plan at Marilyn Woods - The Signature Collection
- The Embassy Plan at Marilyn Woods - The Courtyard Collection
- Sandborn Plan at Marilyn Woods - The Signature Collection
- The Travers Plan at Marilyn Woods - The Courtyard Collection
- Landram Plan at Marilyn Woods - The Signature Collection
- The Taswell Plan at Marilyn Woods - The Classic Collection
- Taswell Plan at Marilyn Woods - The Signature Collection
- 13701 Wendessa Dr
- 11787 Traymoore Dr
- 11799 Traymoore Dr
- 13691 Wendessa Dr
- 11813 Traymoore Dr
- 13710 Darby Dale Ct
- 13700 Darby Dale Ct
- 13690 Darby Dale Ct
- 13681 Wendessa Dr
- 11825 Traymoore Dr
- 13712 Wendessa Dr
- 13702 Wendessa Dr
- 13732 Wendessa Dr
- 13671 Wendessa Dr
- 13680 Darby Dale Ct
- 13751 Wendessa Dr
- 13742 Wendessa Dr
- 13682 Wendessa Dr
- 11812 Traymoore Dr
- 13661 Wendessa Dr