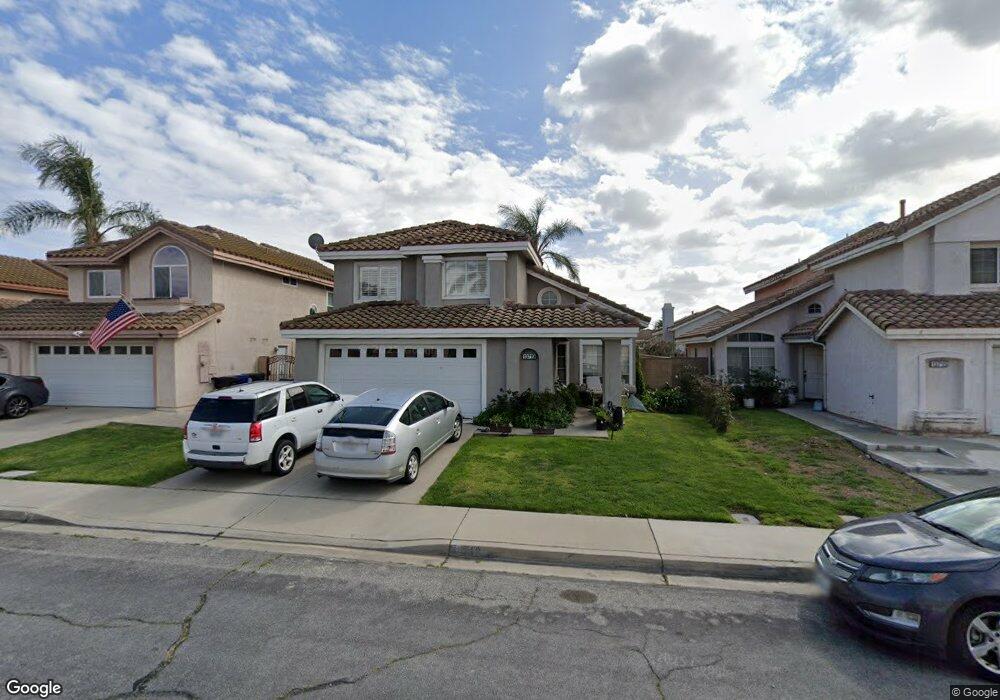
13719 Cabrillo Ct Fontana, CA 92336
West End NeighborhoodEstimated Value: $680,089 - $730,000
4
Beds
3
Baths
1,857
Sq Ft
$380/Sq Ft
Est. Value
About This Home
This home is located at 13719 Cabrillo Ct, Fontana, CA 92336 and is currently estimated at $704,772, approximately $379 per square foot. 13719 Cabrillo Ct is a home located in San Bernardino County with nearby schools including West Heritage Elementary School, Heritage Intermediate School, and Etiwanda High.
Ownership History
Date
Name
Owned For
Owner Type
Purchase Details
Closed on
Nov 3, 2014
Sold by
Yeh Pei Chen
Bought by
Yeh George H and Yeh Pei Chen
Current Estimated Value
Home Financials for this Owner
Home Financials are based on the most recent Mortgage that was taken out on this home.
Original Mortgage
$210,000
Outstanding Balance
$161,870
Interest Rate
4.17%
Mortgage Type
New Conventional
Estimated Equity
$542,902
Purchase Details
Closed on
Apr 5, 2010
Sold by
Executive Capital Group Inc
Bought by
Yeh Pei Chen
Purchase Details
Closed on
Apr 1, 2010
Sold by
Yeh George H
Bought by
Yeh Pei Chen
Purchase Details
Closed on
Jan 14, 2010
Sold by
Zhu Vivienne W
Bought by
Executive Capital Group Inc
Purchase Details
Closed on
Feb 8, 2007
Sold by
Li Lu Mian
Bought by
Zhu Vivienne
Home Financials for this Owner
Home Financials are based on the most recent Mortgage that was taken out on this home.
Original Mortgage
$388,000
Interest Rate
7.62%
Mortgage Type
Purchase Money Mortgage
Create a Home Valuation Report for This Property
The Home Valuation Report is an in-depth analysis detailing your home's value as well as a comparison with similar homes in the area
Home Values in the Area
Average Home Value in this Area
Purchase History
| Date | Buyer | Sale Price | Title Company |
|---|---|---|---|
| Yeh George H | -- | Advantage Title Inc | |
| Yeh Pei Chen | $270,000 | Orange Coast Title | |
| Yeh Pei Chen | -- | Orange Coast Title | |
| Executive Capital Group Inc | $212,500 | Orange Coast Title Company | |
| Zhu Vivienne | $485,000 | North American Title Company |
Source: Public Records
Mortgage History
| Date | Status | Borrower | Loan Amount |
|---|---|---|---|
| Open | Yeh George H | $210,000 | |
| Previous Owner | Zhu Vivienne | $388,000 |
Source: Public Records
Tax History Compared to Growth
Tax History
| Year | Tax Paid | Tax Assessment Tax Assessment Total Assessment is a certain percentage of the fair market value that is determined by local assessors to be the total taxable value of land and additions on the property. | Land | Improvement |
|---|---|---|---|---|
| 2025 | $5,110 | $348,525 | $64,542 | $283,983 |
| 2024 | $5,110 | $341,691 | $63,276 | $278,415 |
| 2023 | $4,982 | $334,991 | $62,035 | $272,956 |
| 2022 | $4,891 | $328,423 | $60,819 | $267,604 |
| 2021 | $4,794 | $321,983 | $59,626 | $262,357 |
| 2020 | $4,800 | $318,682 | $59,015 | $259,667 |
| 2019 | $4,213 | $312,433 | $57,858 | $254,575 |
| 2018 | $4,188 | $306,307 | $56,724 | $249,583 |
| 2017 | $3,995 | $300,301 | $55,612 | $244,689 |
| 2016 | $4,453 | $294,413 | $54,522 | $239,891 |
| 2015 | $4,403 | $289,991 | $53,703 | $236,288 |
| 2014 | $4,269 | $284,310 | $52,651 | $231,659 |
Source: Public Records
Map
Nearby Homes
- 13643 Cabrillo Ct
- 14028 Yorktown Ct
- 14084 Rothchild Ct
- 13414 Columbus Ct
- 8043 Tuscany St
- 7543 W Liberty Pkwy Unit 711
- 13422 Banning St
- 7422 Longstreet Ln
- 14219 Point Loma St
- 13841 Cobblestone Ct
- 7925 Hemingway Ct
- 0 Baseline Ave Unit TR25153298
- 14334 Quail Ct
- 13868 Lexus Ln
- 8221 Ilex St Unit 23
- 8221 Ilex St Unit 10
- 13681 Lexus Ln
- 7194 Trinity St
- 14412 Bing Ave
- 14424 Bing Ave
- 13715 Cabrillo Ct
- 13723 Cabrillo Ct
- 13711 Cabrillo Ct
- 13727 Cabrillo Ct
- 13716 Balboa Ct
- 13720 Balboa Ct
- 13724 Balboa Ct
- 13708 Balboa Ct
- 13707 Cabrillo Ct
- 13731 Cabrillo Ct
- 13722 Cabrillo Ct
- 13726 Cabrillo Ct
- 13718 Cabrillo Ct
- 13728 Balboa Ct
- 13730 Cabrillo Ct
- 13704 Balboa Ct
- 13714 Cabrillo Ct
- 13735 Cabrillo Ct
- 13732 Cabrillo Ct
- 13703 Cabrillo Ct