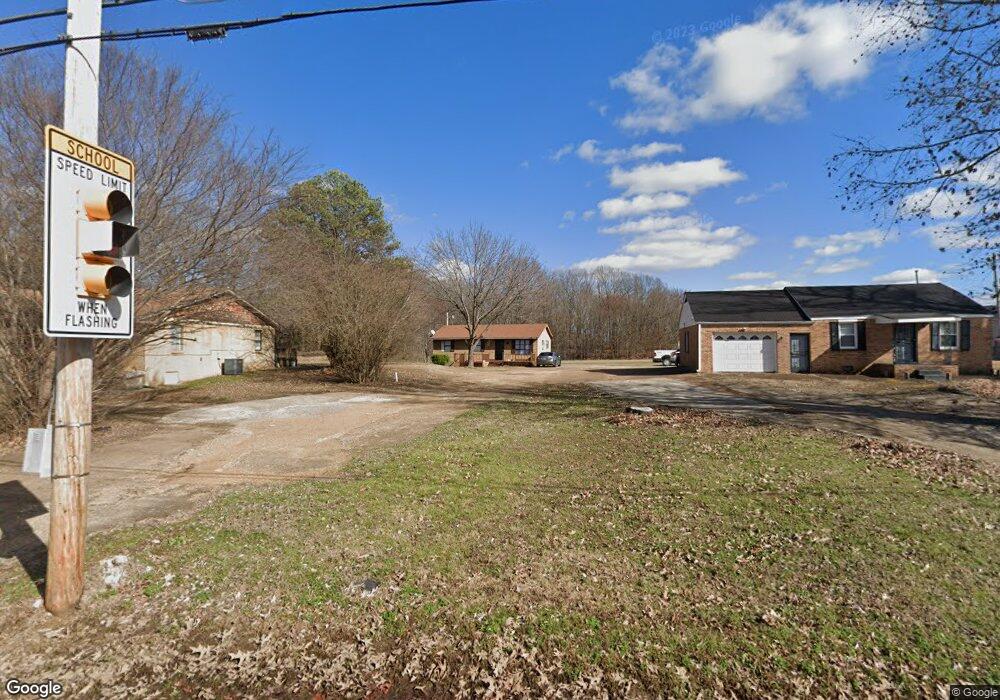
1372 Charles Bryan Rd Cordova, TN 38018
Cordova NeighborhoodEstimated Value: $152,940 - $178,000
2
Beds
1
Bath
912
Sq Ft
$182/Sq Ft
Est. Value
About This Home
This home is located at 1372 Charles Bryan Rd, Cordova, TN 38018 and is currently estimated at $166,235, approximately $182 per square foot. 1372 Charles Bryan Rd is a home located in Shelby County with nearby schools including Dexter Elementary School, Dexter Middle School, and Cordova High School.
Ownership History
Date
Name
Owned For
Owner Type
Purchase Details
Closed on
Sep 12, 2008
Sold by
Nevilles Neomi
Bought by
Nevilles Victor L and Merrick Paul A
Current Estimated Value
Purchase Details
Closed on
Nov 9, 2004
Sold by
Nevilles Neomi
Bought by
Nevilles Neomi and Nevilles Victor L
Purchase Details
Closed on
Apr 7, 2004
Sold by
Freeman Diane
Bought by
Nevilles Neomi
Purchase Details
Closed on
Nov 4, 2003
Sold by
Nevilles Victor Leo
Bought by
Nevilles Neomi
Purchase Details
Closed on
Nov 3, 2003
Sold by
Hayes Steven
Bought by
Nevilles Neomi
Purchase Details
Closed on
Nov 1, 2003
Sold by
Nichols Johnnie Mae
Bought by
Nevilles Neomi
Purchase Details
Closed on
Oct 29, 2003
Sold by
Hayes Harry Lee
Bought by
Nevilles Neomi
Purchase Details
Closed on
Oct 28, 2003
Sold by
Hayes Rosa Marie
Bought by
Nevilles Neomi
Purchase Details
Closed on
Aug 1, 1996
Sold by
Hayes Rosa R and Hayes Vonnie M
Bought by
Hayes Robelia
Create a Home Valuation Report for This Property
The Home Valuation Report is an in-depth analysis detailing your home's value as well as a comparison with similar homes in the area
Home Values in the Area
Average Home Value in this Area
Purchase History
| Date | Buyer | Sale Price | Title Company |
|---|---|---|---|
| Nevilles Victor L | -- | None Available | |
| Nevilles Neomi | -- | -- | |
| Nevilles Neomi | -- | -- | |
| Nevilles Neomi | -- | -- | |
| Nevilles Neomi | -- | -- | |
| Nevilles Neomi | -- | -- | |
| Nevilles Neomi | -- | -- | |
| Nevilles Neomi | -- | -- | |
| Nevilles Neomi | -- | -- | |
| Hayes Robelia | -- | Memphis Title |
Source: Public Records
Tax History Compared to Growth
Tax History
| Year | Tax Paid | Tax Assessment Tax Assessment Total Assessment is a certain percentage of the fair market value that is determined by local assessors to be the total taxable value of land and additions on the property. | Land | Improvement |
|---|---|---|---|---|
| 2025 | $792 | $31,325 | $16,650 | $14,675 |
| 2024 | $792 | $23,375 | $15,375 | $8,000 |
| 2023 | $792 | $23,375 | $15,375 | $8,000 |
| 2022 | $792 | $23,375 | $15,375 | $8,000 |
| 2021 | $806 | $23,375 | $15,375 | $8,000 |
| 2020 | $900 | $22,225 | $15,375 | $6,850 |
| 2019 | $900 | $22,225 | $15,375 | $6,850 |
| 2018 | $900 | $22,225 | $15,375 | $6,850 |
| 2017 | $913 | $22,225 | $15,375 | $6,850 |
| 2016 | $1,026 | $23,475 | $0 | $0 |
| 2014 | $1,026 | $23,475 | $0 | $0 |
Source: Public Records
Map
Nearby Homes
- 1382 Exbury Dr
- 7035 S Estacada Way
- 7194 Charlton Way
- 6916 Lagrange Pines Rd
- 7412 Lost Trail Dr
- 7410 Appling Rain Dr
- 7407 Lost Grove Ln
- 7426 Lost Trail Dr
- 6838 Lagrange Cir N
- 7520 Crystal Lake Dr
- 1321 Winter Springs Ln
- 1520 Cider House Ln
- 1595 Dexter Grove Ct Unit E105
- 1595 Dexter Grove Ct Unit D101
- 6884 Wrigley Dr
- 6880 Wrigley Dr
- 1277 Winter Springs Ln
- 6774 Whitten Pine Dr
- 6890 Century Oaks Dr
- 1089 Links View Ln W
- 1362 Charles Bryan Rd
- 1382 Charles Bryan Rd
- 7168 Mccleskey Cove
- 1398 Charles Bryan Rd
- 7174 Mccleskey Cove
- 1375 Charles Bryan Rd
- 1371 Charles Bryan Rd
- 1344 Charles Bryan Rd
- 1379 Charles Bryan Rd
- 7162 Mccleskey Cove
- 1367 Charles Bryan Rd
- 1385 Charles Bryan Rd
- 7180 Mccleskey Cove
- 1363 Charles Bryan Rd
- 1391 Charles Bryan Rd
- 7186 Mccleskey Cove
- 1395 Charles Bryan Rd
- 1410 Charles Bryan Rd
- 7161 Mccleskey Cove
- 7192 Mccleskey Cove