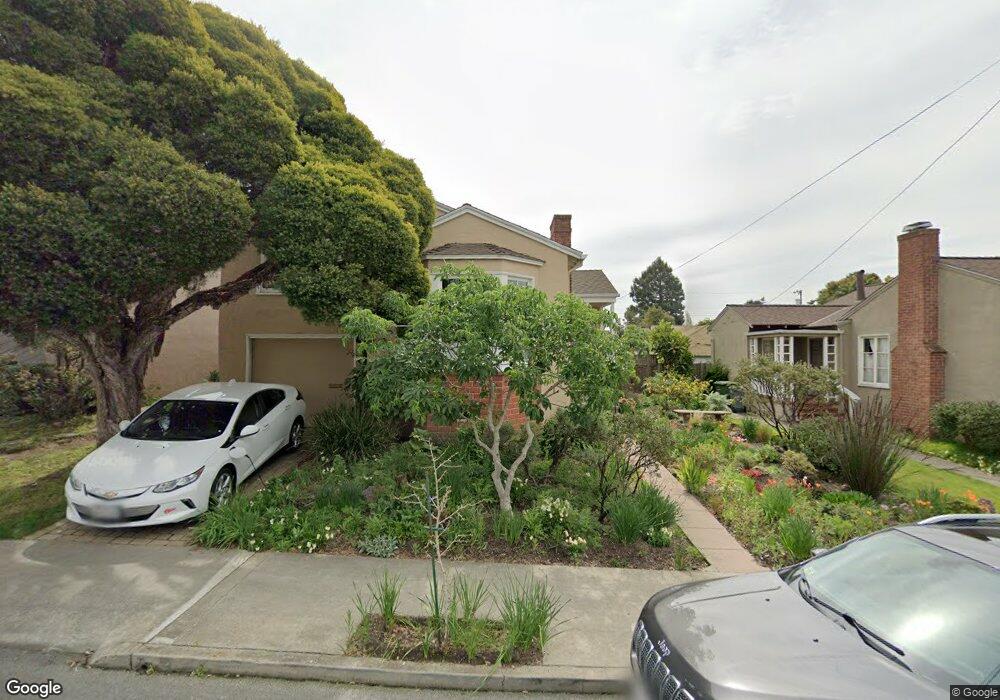
1372 Rose St Berkeley, CA 94702
West Berkeley NeighborhoodEstimated Value: $1,311,000 - $1,508,579
2
Beds
2
Baths
1,467
Sq Ft
$972/Sq Ft
Est. Value
About This Home
This home is located at 1372 Rose St, Berkeley, CA 94702 and is currently estimated at $1,425,395, approximately $971 per square foot. 1372 Rose St is a home located in Alameda County with nearby schools including Ruth Acty Elementary, Berkeley Arts Magnet at Whittier School, and Thousand Oaks Elementary School.
Ownership History
Date
Name
Owned For
Owner Type
Purchase Details
Closed on
Nov 8, 2016
Sold by
Rollins Richard
Bought by
Henny Anne T
Current Estimated Value
Home Financials for this Owner
Home Financials are based on the most recent Mortgage that was taken out on this home.
Original Mortgage
$436,000
Outstanding Balance
$351,351
Interest Rate
3.54%
Mortgage Type
New Conventional
Estimated Equity
$1,074,044
Purchase Details
Closed on
Jul 12, 2007
Sold by
Henny Anne
Bought by
Henny Anne T and Anne T Henny Revocable Trust
Home Financials for this Owner
Home Financials are based on the most recent Mortgage that was taken out on this home.
Original Mortgage
$528,750
Interest Rate
6.51%
Mortgage Type
Purchase Money Mortgage
Purchase Details
Closed on
Jul 24, 1998
Sold by
Maynard Marna A
Bought by
Maynard Marna A and Marna A Maynard Declaration Of
Create a Home Valuation Report for This Property
The Home Valuation Report is an in-depth analysis detailing your home's value as well as a comparison with similar homes in the area
Home Values in the Area
Average Home Value in this Area
Purchase History
| Date | Buyer | Sale Price | Title Company |
|---|---|---|---|
| Henny Anne T | -- | Servicelink | |
| Henny Anne T | -- | Old Republic Title Company | |
| Henny Anne | $705,000 | Old Republic Title Company | |
| Maynard Marna A | -- | -- | |
| Maynard Marna A | -- | -- |
Source: Public Records
Mortgage History
| Date | Status | Borrower | Loan Amount |
|---|---|---|---|
| Open | Henny Anne T | $436,000 | |
| Closed | Henny Anne | $528,750 |
Source: Public Records
Tax History
| Year | Tax Paid | Tax Assessment Tax Assessment Total Assessment is a certain percentage of the fair market value that is determined by local assessors to be the total taxable value of land and additions on the property. | Land | Improvement |
|---|---|---|---|---|
| 2025 | $13,615 | $929,643 | $277,790 | $658,853 |
| 2024 | $13,615 | $911,280 | $272,344 | $645,936 |
| 2023 | $13,339 | $900,281 | $267,006 | $633,275 |
| 2022 | $13,116 | $875,631 | $261,771 | $620,860 |
| 2021 | $13,157 | $858,330 | $256,640 | $608,690 |
| 2020 | $12,494 | $856,459 | $254,009 | $602,450 |
| 2019 | $12,049 | $839,672 | $249,030 | $590,642 |
| 2018 | $11,857 | $823,213 | $244,149 | $579,064 |
| 2017 | $11,441 | $807,075 | $239,363 | $567,712 |
| 2016 | $11,106 | $791,250 | $234,669 | $556,581 |
| 2015 | $10,963 | $779,370 | $231,146 | $548,224 |
| 2014 | $10,899 | $764,109 | $226,620 | $537,489 |
Source: Public Records
Map
Nearby Homes
- 1368 Rose St
- 1631 Belvedere Ave
- 1322 Virginia St
- 1626 Hopkins St
- 1120 Curtis St
- 1728 Curtis St
- 1127 Key Route Blvd
- 1339 Kains Ave
- 1114 Talbot Ave
- 1504 10th St
- 1036 Ramona Ave
- 1919 Curtis St
- 1716 Hearst Ave
- 1498 Sonoma Ave
- 1841 Vine St
- 995 Virginia St
- 1425 Martin Luther King jr Way
- 1625 Martin Luther King jr Way
- 1729 8th St
- 2118 California St
Your Personal Tour Guide
Ask me questions while you tour the home.