Estimated Value: $856,000 - $1,114,000
4
Beds
3
Baths
1,612
Sq Ft
$598/Sq Ft
Est. Value
About This Home
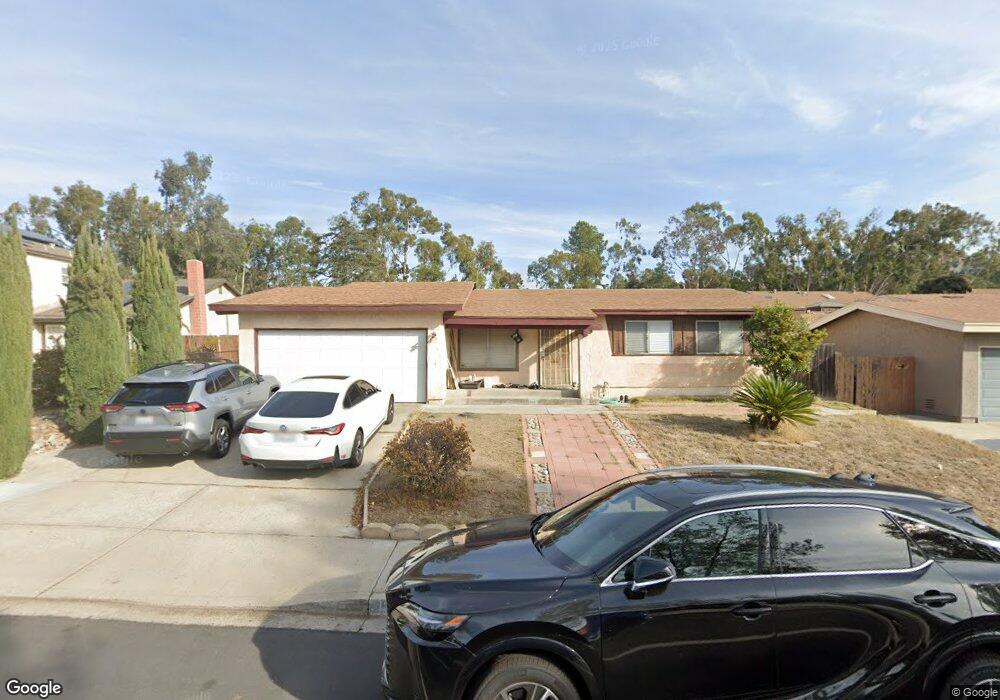
This home is located at 13721 Carriage Rd, Poway, CA 92064 and is currently estimated at $964,613, approximately $598 per square foot. 13721 Carriage Rd is a home located in San Diego County with nearby schools including Valley Elementary School, Meadowbrook Middle, and Poway High.
Ownership History
Date
Name
Owned For
Owner Type
Purchase Details
Closed on
Jun 12, 2013
Sold by
Wu Ming Zhen and Duan Cheng Hua
Bought by
Wu Cheng
Current Estimated Value
Purchase Details
Closed on
May 4, 1998
Sold by
Grimes Canales Desiree R and Canales Peter P
Bought by
Wu Ming Zhen and Duan Cheng Hua
Home Financials for this Owner
Home Financials are based on the most recent Mortgage that was taken out on this home.
Original Mortgage
$118,000
Outstanding Balance
$23,056
Interest Rate
7.1%
Estimated Equity
$941,557
Purchase Details
Closed on
Nov 30, 1993
Sold by
Lane Clark E and Bowman Kevin C
Bought by
Grimes Desiree R and Canales Peter P
Home Financials for this Owner
Home Financials are based on the most recent Mortgage that was taken out on this home.
Original Mortgage
$138,895
Interest Rate
6.98%
Mortgage Type
FHA
Purchase Details
Closed on
Jul 28, 1986
Create a Home Valuation Report for This Property
The Home Valuation Report is an in-depth analysis detailing your home's value as well as a comparison with similar homes in the area
Home Values in the Area
Average Home Value in this Area
Purchase History
We collect this data history from publicly available records. To have your information removed, we recommend requesting removal directly through your county’s website.
| Date | Buyer | Sale Price | Title Company |
|---|---|---|---|
| Wu Cheng | -- | None Available | |
| Wu Ming Zhen | $147,500 | Benefit Land Title Co | |
| Grimes Desiree R | $140,000 | Fidelity National Title Co | |
| -- | $109,000 | -- |
Source: Public Records
Mortgage History
We collect this data history from publicly available records. To have your information removed, we recommend requesting removal directly through your county’s website.
| Date | Status | Borrower | Loan Amount |
|---|---|---|---|
| Open | Wu Ming Zhen | $118,000 | |
| Previous Owner | Grimes Desiree R | $138,895 |
Source: Public Records
Tax History
| Year | Tax Paid | Tax Assessment Tax Assessment Total Assessment is a certain percentage of the fair market value that is determined by local assessors to be the total taxable value of land and additions on the property. | Land | Improvement |
|---|---|---|---|---|
| 2025 | $3,411 | $293,148 | $159,665 | $133,483 |
| 2024 | $3,322 | $287,401 | $156,535 | $130,866 |
| 2023 | $3,253 | $281,766 | $153,466 | $128,300 |
| 2022 | $3,200 | $276,242 | $150,457 | $125,785 |
| 2021 | $3,159 | $270,826 | $147,507 | $123,319 |
| 2020 | $3,118 | $268,050 | $145,995 | $122,055 |
| 2019 | $3,039 | $262,795 | $143,133 | $119,662 |
| 2018 | $2,955 | $257,643 | $140,327 | $117,316 |
| 2017 | $170 | $252,592 | $137,576 | $115,016 |
| 2016 | $2,819 | $247,640 | $134,879 | $112,761 |
| 2015 | $2,779 | $243,921 | $132,853 | $111,068 |
| 2014 | $2,716 | $239,144 | $130,251 | $108,893 |
Source: Public Records
Map
Nearby Homes
- 13641 Carriage Rd
- 12939 Cree Ct
- 13944 Arbolitos Dr
- 12938 Yankton Dr
- 12834 Rockwell Ct
- 12862 Carriage Heights Way
- 12745 Robison Blvd Unit 18
- 13056 Poway Rd
- 13824 Powers Rd
- 1/2 Poway Rd
- 13757 Eisenhower Ave
- 13068 Olympus Cir Unit 1
- 13871 Olive Grove Place
- 13254 Powers Ct
- 14125 Halper Rd
- 14212 Tobiasson Rd
- 13111 Tobiasson Rd
- 12953 Carriage Rd
- 14210 Frame Rd
- 12717 Harmon Rd
- 13713 Carriage Rd
- 13729 Carriage Rd
- 13666 Starridge St
- 13658 Starridge St
- 13705 Carriage Rd
- 13737 Carriage Rd
- 13650 Starridge St
- 13722 Carriage Rd
- 13714 Carriage Rd
- 13730 Carriage Rd
- 13649 Carriage Rd
- 13642 Starridge St
- 13704 Carriage Rd
- 13717 Utopia Rd
- 13738 Carriage Rd
- 13709 Utopia Rd
- 13725 Utopia Rd
- 13638 Starridge St
- 13701 Utopia Rd
- 13646 Carriage Rd
Your Personal Tour Guide
Ask me questions while you tour the home.