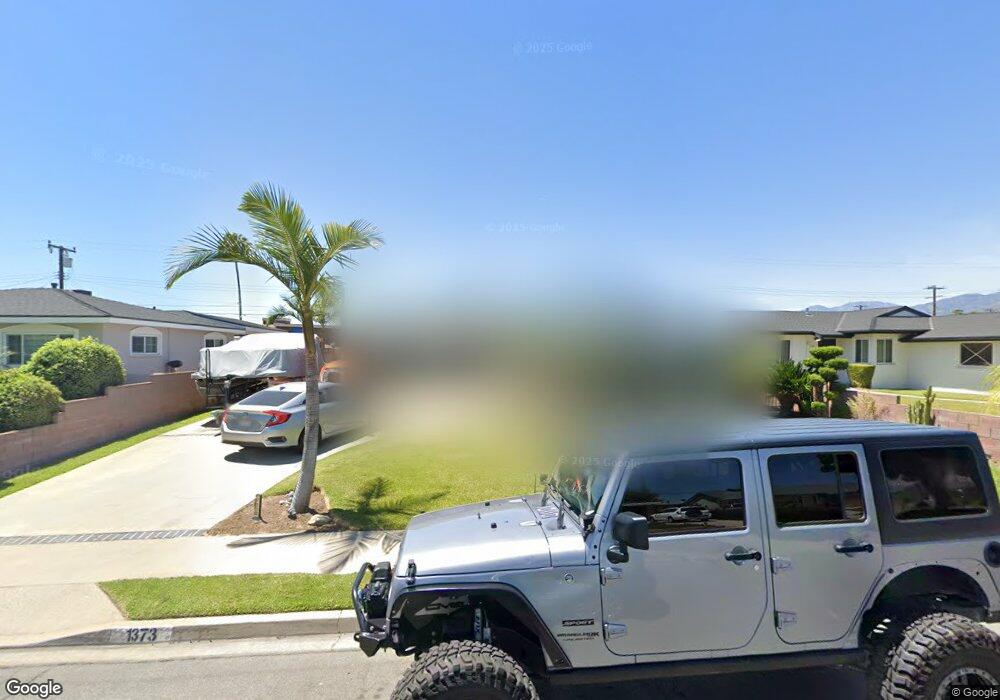
1373 N Midsite Ave Covina, CA 91722
Estimated Value: $715,939 - $880,000
3
Beds
2
Baths
1,166
Sq Ft
$669/Sq Ft
Est. Value
About This Home
This home is located at 1373 N Midsite Ave, Covina, CA 91722 and is currently estimated at $779,985, approximately $668 per square foot. 1373 N Midsite Ave is a home located in Los Angeles County with nearby schools including Cypress Elementary School, Las Palmas Middle School, and Northview High School.
Ownership History
Date
Name
Owned For
Owner Type
Purchase Details
Closed on
Feb 17, 2017
Sold by
Valdez Jorge
Bought by
Espinoza Cynthia
Current Estimated Value
Home Financials for this Owner
Home Financials are based on the most recent Mortgage that was taken out on this home.
Original Mortgage
$288,750
Outstanding Balance
$238,430
Interest Rate
4.19%
Mortgage Type
New Conventional
Estimated Equity
$541,555
Purchase Details
Closed on
Mar 7, 2001
Sold by
Valdez Jorge and Valdez George
Bought by
Valdez Jorge
Home Financials for this Owner
Home Financials are based on the most recent Mortgage that was taken out on this home.
Original Mortgage
$184,104
Interest Rate
7.06%
Mortgage Type
FHA
Purchase Details
Closed on
Oct 17, 2000
Sold by
Englebrecht Orval L and Englebrecht Renee M
Bought by
Valdez George
Home Financials for this Owner
Home Financials are based on the most recent Mortgage that was taken out on this home.
Original Mortgage
$184,479
Interest Rate
7.9%
Mortgage Type
FHA
Create a Home Valuation Report for This Property
The Home Valuation Report is an in-depth analysis detailing your home's value as well as a comparison with similar homes in the area
Home Values in the Area
Average Home Value in this Area
Purchase History
| Date | Buyer | Sale Price | Title Company |
|---|---|---|---|
| Espinoza Cynthia | $385,000 | Chicago Title Company | |
| Valdez Jorge | -- | Benefit Land Title Company | |
| Valdez George | $186,000 | American Title Co |
Source: Public Records
Mortgage History
| Date | Status | Borrower | Loan Amount |
|---|---|---|---|
| Open | Espinoza Cynthia | $288,750 | |
| Previous Owner | Valdez Jorge | $184,104 | |
| Previous Owner | Valdez George | $184,479 |
Source: Public Records
Tax History Compared to Growth
Tax History
| Year | Tax Paid | Tax Assessment Tax Assessment Total Assessment is a certain percentage of the fair market value that is determined by local assessors to be the total taxable value of land and additions on the property. | Land | Improvement |
|---|---|---|---|---|
| 2025 | $5,827 | $446,818 | $357,456 | $89,362 |
| 2024 | $5,558 | $438,058 | $350,448 | $87,610 |
| 2023 | $5,476 | $429,470 | $343,577 | $85,893 |
| 2022 | $5,403 | $421,050 | $336,841 | $84,209 |
| 2021 | $5,323 | $412,795 | $330,237 | $82,558 |
| 2019 | $5,201 | $400,553 | $320,443 | $80,110 |
| 2018 | $4,937 | $392,700 | $314,160 | $78,540 |
| 2016 | $3,112 | $242,063 | $142,047 | $100,016 |
| 2015 | $3,023 | $238,428 | $139,914 | $98,514 |
| 2014 | $2,984 | $233,759 | $137,174 | $96,585 |
Source: Public Records
Map
Nearby Homes
- 1357 N Aldenville Ave
- 821 S Cerritos Ave Unit 13
- 1348 N Armel Dr
- 543 E Arrow Hwy Unit 16
- 495 Andrew Dr Unit G
- 218 W Alcross St
- 479 Marc Place Unit C
- 217 W Alcross St
- 17909 E Laxford Rd
- 1380 N Citrus Ave Unit G5
- 804 W Grondahl St Unit D
- 777 S Citrus Ave Unit 221
- 777 S Citrus Ave Unit 119
- 1143 Orchard Dr
- 815 W Grondahl St Unit E
- 814 W Grondahl St Unit A
- 4692 N Edenfield Ave
- 4626 N Larkin Dr
- 4739 N Conwell Ave
- 760 S Azusa Ave Unit G
- 1381 N Midsite Ave
- 1365 N Midsite Ave
- 1372 N Glenfinnan Ave
- 1364 N Glenfinnan Ave
- 1380 N Glenfinnan Ave
- 1357 N Midsite Ave
- 1403 N Midsite Ave
- 1372 N Midsite Ave
- 1356 N Glenfinnan Ave
- 1364 N Midsite Ave
- 1380 N Midsite Ave
- 1402 N Glenfinnan Ave
- 1347 N Midsite Ave
- 1356 N Midsite Ave
- 1402 N Midsite Ave
- 1346 N Glenfinnan Ave
- 1408 N Glenfinnan Ave
- 1346 N Midsite Ave
- 1410 N Midsite Ave
- 1373 N Glenfinnan Ave