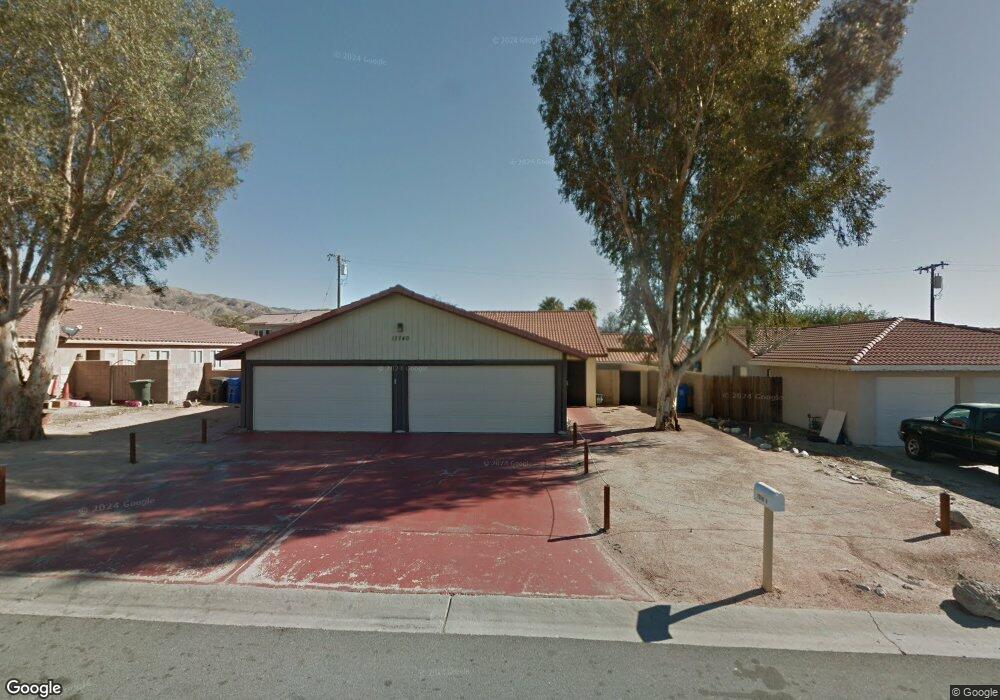
13740 Sarita Dr Unit B Desert Hot Springs, CA 92240
Estimated Value: $207,496 - $503,000
2
Beds
2
Baths
1,002
Sq Ft
$379/Sq Ft
Est. Value
About This Home
This home is located at 13740 Sarita Dr Unit B, Desert Hot Springs, CA 92240 and is currently estimated at $379,374, approximately $378 per square foot. 13740 Sarita Dr Unit B is a home located in Riverside County with nearby schools including Cabot Yerxa Elementary School, Desert Springs Middle School, and Desert Hot Springs High School.
Ownership History
Date
Name
Owned For
Owner Type
Purchase Details
Closed on
Jan 12, 2016
Sold by
Verdugo Edward A
Bought by
Dhs Portfolio Properties Llc
Current Estimated Value
Purchase Details
Closed on
Nov 2, 2002
Sold by
Gilbreath Twila
Bought by
Verdugo Edward A
Purchase Details
Closed on
Jun 3, 2002
Sold by
Gilbreath Diane
Bought by
Gilbreath Ron D
Purchase Details
Closed on
May 28, 2002
Sold by
Soukup Charles Frank
Bought by
Gilbreath Ron D
Purchase Details
Closed on
Mar 25, 1997
Sold by
Soukup Charles F
Bought by
Soukup Charles F
Purchase Details
Closed on
Nov 25, 1996
Sold by
Stover Joseph M
Bought by
Neth Andree J
Purchase Details
Closed on
Oct 25, 1996
Sold by
Neth Andree J
Bought by
Soukup Charles F and Neth Andree J
Purchase Details
Closed on
May 24, 1995
Sold by
Neth Andree J
Bought by
Neth Andree J and Stover Joseph M
Create a Home Valuation Report for This Property
The Home Valuation Report is an in-depth analysis detailing your home's value as well as a comparison with similar homes in the area
Home Values in the Area
Average Home Value in this Area
Purchase History
| Date | Buyer | Sale Price | Title Company |
|---|---|---|---|
| Dhs Portfolio Properties Llc | -- | None Available | |
| Verdugo Edward A | $81,000 | Chicago Title Inland Empire | |
| Gilbreath Ron D | -- | Fidelity National Title Ins | |
| Gilbreath Ron D | $68,000 | Fidelity National Title Ins | |
| Soukup Charles F | -- | -- | |
| Neth Andree J | -- | -- | |
| Soukup Charles F | -- | -- | |
| Neth Andree J | -- | -- | |
| Neth Andree J | -- | -- |
Source: Public Records
Tax History Compared to Growth
Tax History
| Year | Tax Paid | Tax Assessment Tax Assessment Total Assessment is a certain percentage of the fair market value that is determined by local assessors to be the total taxable value of land and additions on the property. | Land | Improvement |
|---|---|---|---|---|
| 2025 | $3,330 | $189,398 | $18,935 | $170,463 |
| 2023 | $3,330 | $182,045 | $18,200 | $163,845 |
| 2022 | $3,366 | $178,477 | $17,844 | $160,633 |
| 2021 | $3,313 | $174,979 | $17,495 | $157,484 |
| 2020 | $3,204 | $173,186 | $17,316 | $155,870 |
| 2019 | $3,157 | $169,791 | $16,977 | $152,814 |
| 2018 | $3,070 | $166,463 | $16,646 | $149,817 |
| 2017 | $2,978 | $163,200 | $16,320 | $146,880 |
| 2016 | $2,532 | $135,228 | $31,205 | $104,023 |
| 2015 | $1,282 | $88,830 | $10,449 | $78,381 |
| 2014 | $1,264 | $87,093 | $10,246 | $76,847 |
Source: Public Records
Map
Nearby Homes
- 13704 Sarita Dr
- 0 Joseph Way Unit 219122901DA
- 66590 Joseph Way
- 1 Joseph Way
- 2 Joseph Way
- 13547 Caliente Dr
- 13405 Ocotillo Rd
- 0 Linteau Ln Unit 219131666DA
- 0 Redbud Unit IV25192756
- 13834 Cactus Dr
- 12340 Cactus Dr
- 66208 Palo Verde Trail
- 13423 Ramona Dr
- 66792 Hacienda Ave
- 13165 Ramona Dr
- 66765 Granada Ave
- 14285 W Agua Dulce Dr
- 14777 Palm Dr Unit 35
- 14777 Palm Dr Unit 113
- 14777 Palm Dr Unit 157
- 13740 Sarita Dr Unit A
- 13740 Sarita Dr
- 13724 Sarita Dr Unit A-B
- 13724 Sarita Dr
- 13760 Sarita Dr
- 13735 Susan Way
- 13725 Susan Way
- 13785 Susan Way
- 13735 Sarita Dr
- 13723 Susan Way
- 13755 Sarita Dr Unit A
- 13755 Sarita Dr Unit A & B
- 13755 Sarita Dr Unit B
- 13755 Sarita Dr Unit A & B
- 13755 Sarita Dr Unit 3
- 4 Commercial Lots On Palm Dr
- 13775 Sarita Dr
- 13800 Sarita Dr
- 13795 Sarita Dr
- 13782 Susan Way