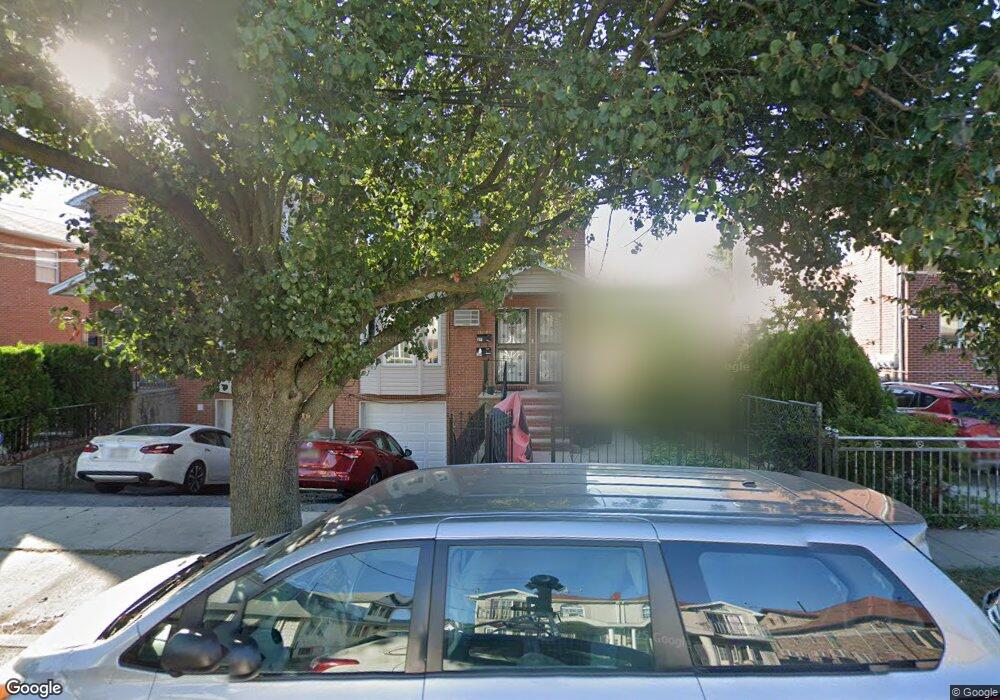
13742 Laburnum Ave Unit 1STFLOOR Flushing, NY 11355
Flushing NeighborhoodEstimated Value: $1,538,000 - $1,966,000
3
Beds
--
Bath
1,000
Sq Ft
$1,716/Sq Ft
Est. Value
About This Home
This home is located at 13742 Laburnum Ave Unit 1STFLOOR, Flushing, NY 11355 and is currently estimated at $1,716,420, approximately $1,716 per square foot. 13742 Laburnum Ave Unit 1STFLOOR is a home located in Queens County with nearby schools including P.S. 024 Andrew Jackson School, Rachel Carson I.S. 237Q, and John Bowne High School.
Ownership History
Date
Name
Owned For
Owner Type
Purchase Details
Closed on
Sep 23, 2016
Sold by
Lim Jenny
Bought by
Wang Bao Yu and Wang Rui Jie
Current Estimated Value
Home Financials for this Owner
Home Financials are based on the most recent Mortgage that was taken out on this home.
Original Mortgage
$533,850
Outstanding Balance
$426,419
Interest Rate
3.43%
Mortgage Type
Purchase Money Mortgage
Estimated Equity
$1,290,001
Purchase Details
Closed on
Feb 28, 2001
Sold by
Laburnum Avenue Owners Corp
Bought by
Lim Jenny
Home Financials for this Owner
Home Financials are based on the most recent Mortgage that was taken out on this home.
Original Mortgage
$300,000
Interest Rate
6.93%
Purchase Details
Closed on
Oct 4, 1999
Sold by
Ranieri Rose
Bought by
Laburnum Avenue Owners Corp
Create a Home Valuation Report for This Property
The Home Valuation Report is an in-depth analysis detailing your home's value as well as a comparison with similar homes in the area
Home Values in the Area
Average Home Value in this Area
Purchase History
| Date | Buyer | Sale Price | Title Company |
|---|---|---|---|
| Wang Bao Yu | $989,000 | -- | |
| Lim Jenny | $500,000 | -- | |
| Laburnum Avenue Owners Corp | $50,000 | -- |
Source: Public Records
Mortgage History
| Date | Status | Borrower | Loan Amount |
|---|---|---|---|
| Open | Wang Bao Yu | $533,850 | |
| Previous Owner | Lim Jenny | $300,000 |
Source: Public Records
Tax History Compared to Growth
Tax History
| Year | Tax Paid | Tax Assessment Tax Assessment Total Assessment is a certain percentage of the fair market value that is determined by local assessors to be the total taxable value of land and additions on the property. | Land | Improvement |
|---|---|---|---|---|
| 2025 | $13,730 | $72,460 | $9,397 | $63,063 |
| 2024 | $13,730 | $68,359 | $8,652 | $59,707 |
| 2023 | $13,514 | $67,284 | $8,397 | $58,887 |
| 2022 | $13,217 | $93,000 | $13,920 | $79,080 |
| 2021 | $13,470 | $98,160 | $13,920 | $84,240 |
| 2020 | $12,781 | $107,880 | $13,920 | $93,960 |
| 2019 | $11,917 | $95,100 | $13,920 | $81,180 |
| 2018 | $11,430 | $56,070 | $11,118 | $44,952 |
| 2017 | $11,247 | $55,174 | $11,209 | $43,965 |
| 2016 | $10,663 | $55,174 | $11,209 | $43,965 |
| 2015 | $6,058 | $50,319 | $13,551 | $36,768 |
| 2014 | $6,058 | $47,472 | $15,348 | $32,124 |
Source: Public Records
Map
Nearby Homes
- 137-38 Kalmia Ave
- 46-40 Kissena Blvd
- 14014 Negundo Ave
- 50-16 Kissena Blvd
- 140-15 Holly Ave Unit 6M
- 140-15 Holly Ave Unit 2M
- 140-15 Holly Ave Unit 4E
- 140-03 Poplar Ave
- 14015 Holly Ave Unit D
- 137-42 Geranium Ave
- 15110 Peck Ave
- 46-06 Bowne St
- 140-24 Quince Ave
- 137-40 45th Ave Unit 1L
- 137-40 45th Ave Unit 2A
- 54-13 152nd St
- 140-19 Rose Ave
- 143-16 Holly Ave
- 54-36 152nd St
- 140-50 Quince Ave
- 13742 Laburnum Ave Unit 2Fl
- 13742 Laburnum Ave
- 13742 Laburnum Ave Unit 1Fl
- 13742 Laburnum Ave
- 13744 Laburnum Ave Unit 2nd FL
- 13744 Laburnum Ave
- 13738 Laburnum Ave
- 13748 Laburnum Ave
- 13736 Laburnum Ave
- 137-36 Laburnum Ave Unit 1FL
- 13750 Laburnum Ave
- 13734 Laburnum Ave
- 13734 Laburnum Ave Unit 137-38
- 13729 Mulberry Ave
- 13737 Mulberry Ave
- 13754 Laburnum Ave
- 13725 Mulberry Ave
- 13732 Laburnum Ave
- 137-39 Laburnum Ave
- 13739 Mulberry Ave