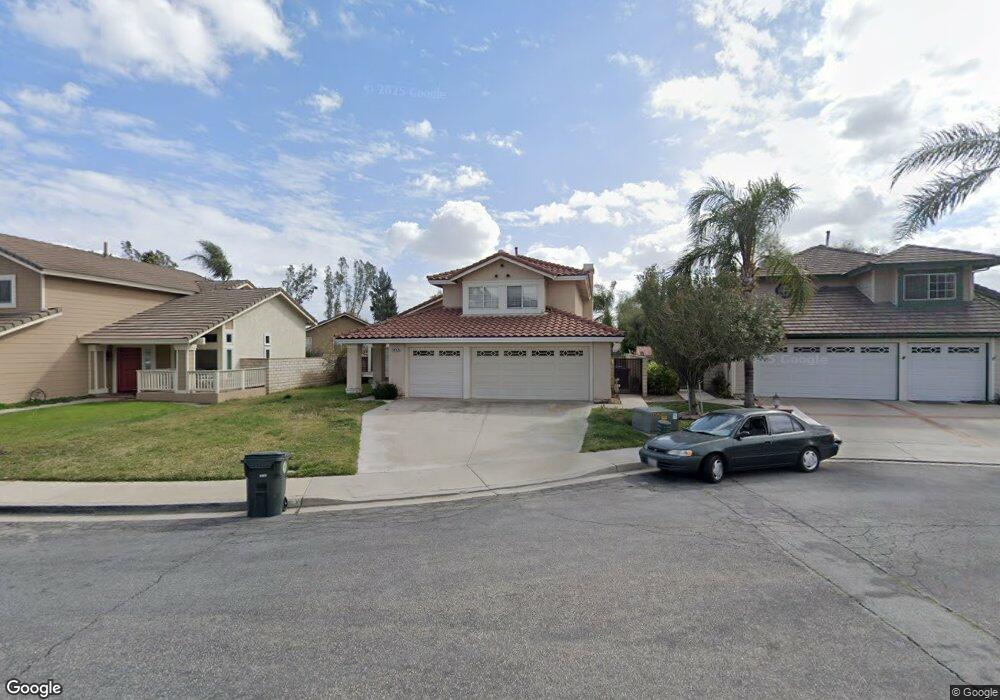
13747 San Gabriel Ct Fontana, CA 92336
West End NeighborhoodEstimated Value: $733,406 - $787,000
4
Beds
3
Baths
1,943
Sq Ft
$388/Sq Ft
Est. Value
About This Home
This home is located at 13747 San Gabriel Ct, Fontana, CA 92336 and is currently estimated at $754,102, approximately $388 per square foot. 13747 San Gabriel Ct is a home located in San Bernardino County with nearby schools including West Heritage Elementary School, Heritage Intermediate School, and Etiwanda High.
Ownership History
Date
Name
Owned For
Owner Type
Purchase Details
Closed on
Dec 26, 2008
Sold by
Guts Properties Llc
Bought by
Perez Alex and Perez Maria
Current Estimated Value
Home Financials for this Owner
Home Financials are based on the most recent Mortgage that was taken out on this home.
Original Mortgage
$278,000
Outstanding Balance
$178,608
Interest Rate
5.49%
Mortgage Type
Purchase Money Mortgage
Estimated Equity
$575,494
Purchase Details
Closed on
Aug 4, 2008
Sold by
Ord Daniel
Bought by
Guts Properties Llc
Purchase Details
Closed on
May 13, 1999
Sold by
Federal National Mortgage Association
Bought by
Ord Daniel and Ord Elizabeth
Home Financials for this Owner
Home Financials are based on the most recent Mortgage that was taken out on this home.
Original Mortgage
$163,353
Interest Rate
6.92%
Mortgage Type
FHA
Purchase Details
Closed on
Dec 24, 1998
Sold by
Banuelos Carlos G and Banuelos Laura E
Bought by
Federal National Mortgage Association
Create a Home Valuation Report for This Property
The Home Valuation Report is an in-depth analysis detailing your home's value as well as a comparison with similar homes in the area
Home Values in the Area
Average Home Value in this Area
Purchase History
| Date | Buyer | Sale Price | Title Company |
|---|---|---|---|
| Perez Alex | $293,000 | First American Title Company | |
| Guts Properties Llc | -- | First American Title Company | |
| Ord Daniel | $165,000 | Chicago Title Co | |
| Federal National Mortgage Association | $146,446 | United Title Company |
Source: Public Records
Mortgage History
| Date | Status | Borrower | Loan Amount |
|---|---|---|---|
| Open | Perez Alex | $278,000 | |
| Previous Owner | Ord Daniel | $163,353 |
Source: Public Records
Tax History Compared to Growth
Tax History
| Year | Tax Paid | Tax Assessment Tax Assessment Total Assessment is a certain percentage of the fair market value that is determined by local assessors to be the total taxable value of land and additions on the property. | Land | Improvement |
|---|---|---|---|---|
| 2025 | $5,336 | $377,184 | $94,295 | $282,889 |
| 2024 | $5,336 | $369,788 | $92,446 | $277,342 |
| 2023 | $4,767 | $362,537 | $90,633 | $271,904 |
| 2022 | $4,697 | $355,429 | $88,856 | $266,573 |
| 2021 | $4,613 | $348,460 | $87,114 | $261,346 |
| 2020 | $4,518 | $344,887 | $86,221 | $258,666 |
| 2019 | $4,413 | $338,124 | $84,530 | $253,594 |
| 2018 | $4,385 | $331,495 | $82,873 | $248,622 |
| 2017 | $4,182 | $324,995 | $81,248 | $243,747 |
| 2016 | $4,878 | $318,623 | $79,655 | $238,968 |
| 2015 | $4,826 | $313,837 | $78,459 | $235,378 |
| 2014 | $4,685 | $307,689 | $76,922 | $230,767 |
Source: Public Records
Map
Nearby Homes
- 8043 Tuscany St
- 14028 Yorktown Ct
- 14084 Rothchild Ct
- 13643 Cabrillo Ct
- 13841 Cobblestone Ct
- 13414 Columbus Ct
- 14219 Point Loma St
- 13868 Lexus Ln
- 13422 Banning St
- 13681 Lexus Ln
- 7543 W Liberty Pkwy Unit 711
- 8221 Ilex St Unit 23
- 8221 Ilex St Unit 10
- 7925 Hemingway Ct
- 14412 Bing Ave
- 7422 Longstreet Ln
- 14424 Bing Ave
- 14428 Bing Ave
- 14432 Bing Ave
- 14334 Quail Ct
- 13751 San Gabriel Ct
- 13745 San Gabriel Ct
- 13730 Arapaho St
- 13720 Arapaho St
- 13755 San Gabriel Ct
- 13710 Arapaho St
- 13740 Arapaho St
- 13743 San Gabriel Ct
- 7873 Iroquois St
- 7863 Iroquois St
- 7850 Sioux St
- 13756 San Gabriel Ct
- 13746 San Gabriel Ct
- 13700 Arapaho St
- 13752 San Gabriel Ct
- 13748 San Gabriel Ct
- 7853 Iroquois St
- 7840 Sioux St
- 7843 Iroquois St
- 13765 Tulare Ct