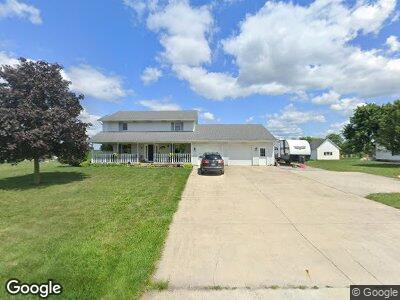
13747 Yorkshire Osgood Rd Yorkshire, OH 45388
Estimated Value: $358,000 - $402,625
3
Beds
3
Baths
2,232
Sq Ft
$173/Sq Ft
Est. Value
About This Home
This home is located at 13747 Yorkshire Osgood Rd, Yorkshire, OH 45388 and is currently estimated at $386,156, approximately $173 per square foot. 13747 Yorkshire Osgood Rd is a home located in Darke County with nearby schools including Versailles Elementary School, Versailles Middle School, and Versailles High School.
Ownership History
Date
Name
Owned For
Owner Type
Purchase Details
Closed on
Apr 26, 2021
Sold by
Marshal Mark L and Marshal Connie
Bought by
Hoelscher Renee and Hoelscher Dustin M
Current Estimated Value
Home Financials for this Owner
Home Financials are based on the most recent Mortgage that was taken out on this home.
Original Mortgage
$310,800
Outstanding Balance
$285,227
Interest Rate
3.1%
Mortgage Type
VA
Estimated Equity
$91,763
Purchase Details
Closed on
May 2, 2008
Sold by
Smith Thomas W and Brackman Diana M
Bought by
Marshal Mark L and Marshal Connie M
Home Financials for this Owner
Home Financials are based on the most recent Mortgage that was taken out on this home.
Original Mortgage
$150,800
Interest Rate
5.88%
Mortgage Type
FHA
Purchase Details
Closed on
Apr 29, 1991
Bought by
Marshal Mark L and Marshal Connie M
Create a Home Valuation Report for This Property
The Home Valuation Report is an in-depth analysis detailing your home's value as well as a comparison with similar homes in the area
Home Values in the Area
Average Home Value in this Area
Purchase History
| Date | Buyer | Sale Price | Title Company |
|---|---|---|---|
| Hoelscher Renee | $310,800 | Mortgage Connect Lp | |
| Marshal Mark L | $152,000 | None Available | |
| Marshal Mark L | -- | -- |
Source: Public Records
Mortgage History
| Date | Status | Borrower | Loan Amount |
|---|---|---|---|
| Open | Hoelscher Renee | $310,800 | |
| Previous Owner | Marshal Connie M | $166,866 | |
| Previous Owner | Marshall Mark L | $25,485 | |
| Previous Owner | Marshal Mark L | $140,400 | |
| Previous Owner | Marshal Mark L | $150,599 | |
| Previous Owner | Marshal Mark L | $150,800 |
Source: Public Records
Tax History Compared to Growth
Tax History
| Year | Tax Paid | Tax Assessment Tax Assessment Total Assessment is a certain percentage of the fair market value that is determined by local assessors to be the total taxable value of land and additions on the property. | Land | Improvement |
|---|---|---|---|---|
| 2024 | $3,372 | $108,330 | $6,620 | $101,710 |
| 2023 | $3,376 | $108,330 | $6,620 | $101,710 |
| 2022 | $3,173 | $100,930 | $5,520 | $95,410 |
| 2021 | $1,791 | $52,550 | $5,520 | $47,030 |
| 2020 | $1,801 | $52,550 | $5,520 | $47,030 |
| 2019 | $1,616 | $47,510 | $5,520 | $41,990 |
| 2018 | $1,611 | $47,510 | $5,520 | $41,990 |
| 2017 | $1,420 | $47,510 | $5,520 | $41,990 |
| 2016 | $1,422 | $43,850 | $5,520 | $38,330 |
| 2015 | $1,422 | $43,850 | $5,520 | $38,330 |
| 2014 | $1,495 | $43,850 | $5,520 | $38,330 |
| 2013 | $1,609 | $43,580 | $5,250 | $38,330 |
Source: Public Records
Map
Nearby Homes
- 155 Liberty Dr
- 156 Veterans Dr
- 153 Liberty Dr
- 160 Mendenhall Rd
- 159 Mendenhall Rd
- 158 Mendenhall Rd
- 157 Mendenhall Rd
- 152 Liberty Dr
- 154 Liberty Dr
- 136 Liberty Dr
- 151 Brewer Dr
- 135 Veterans Dr
- 150 Brewer Dr
- 145 Liberty Dr
- 149 Brewer Dr
- 143 Liberty Dr
- 148 Brewer Dr
- 139 Liberty Dr
- 138 Liberty Dr
- 137 Liberty Dr
- 13747 Yorkshire Osgood Rd
- 13741 Yorkshire Osgood Rd
- 13777 Yorkshire Osgood Rd
- 152 East St
- 301 York St
- 0 Yorkshire-Osgood Rd
- 18 E Main St
- 300 York St
- 12 E Main St
- 104 W Main St
- 106 W Main St
- 22 E Main St
- 101 W Main St
- 21 E Main St
- 105 W Main St
- 118 W Main St
- 50 E Yorkshire Osgood Rd
- 27 E Main St
- 111 W Main St
- 109 W Main St