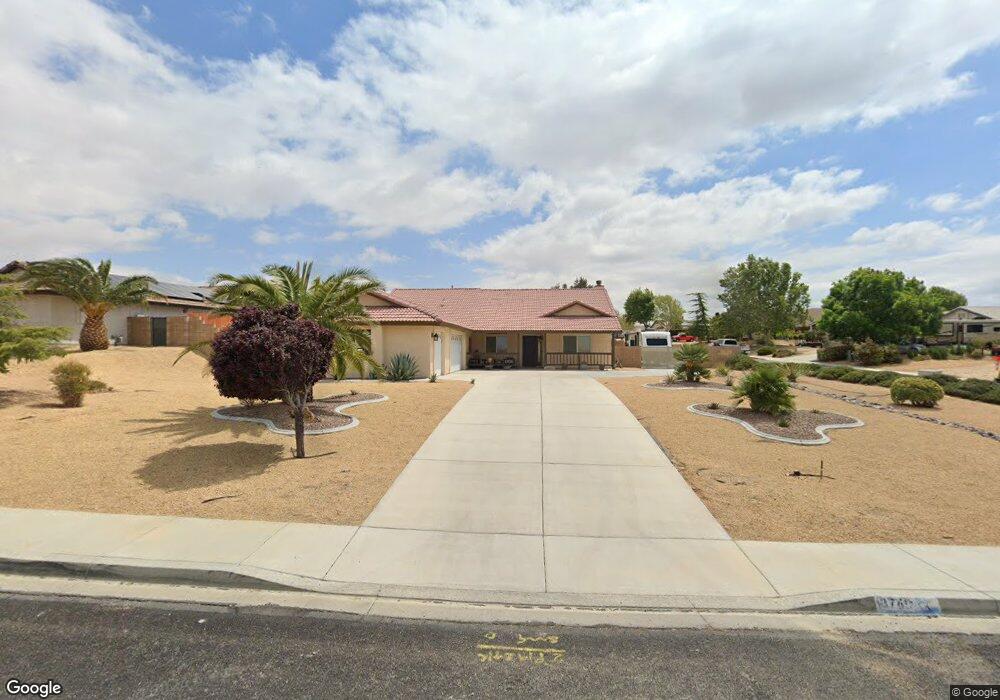
13749 Sahale Ct Apple Valley, CA 92307
High Desert NeighborhoodEstimated Value: $491,025 - $557,000
4
Beds
2
Baths
1,941
Sq Ft
$276/Sq Ft
Est. Value
About This Home
This home is located at 13749 Sahale Ct, Apple Valley, CA 92307 and is currently estimated at $535,006, approximately $275 per square foot. 13749 Sahale Ct is a home located in San Bernardino County with nearby schools including Rio Vista School of Applied Learning, Apple Valley High School, and Academy for Academic Excellence.
Ownership History
Date
Name
Owned For
Owner Type
Purchase Details
Closed on
Jul 29, 2017
Sold by
Wharton Michelle Yvonne
Bought by
Sweeney Zachary D and Sweeney Kolbie R
Current Estimated Value
Home Financials for this Owner
Home Financials are based on the most recent Mortgage that was taken out on this home.
Original Mortgage
$309,195
Outstanding Balance
$257,370
Interest Rate
3.87%
Mortgage Type
FHA
Estimated Equity
$277,636
Purchase Details
Closed on
Nov 6, 2002
Sold by
West River Bend Lp
Bought by
Wharton Michelle Yvonne
Home Financials for this Owner
Home Financials are based on the most recent Mortgage that was taken out on this home.
Original Mortgage
$81,419
Interest Rate
5.78%
Mortgage Type
Construction
Purchase Details
Closed on
Mar 23, 2002
Sold by
High Country Development Company 2
Bought by
West River Bend Lp
Home Financials for this Owner
Home Financials are based on the most recent Mortgage that was taken out on this home.
Original Mortgage
$8,000
Interest Rate
6.87%
Mortgage Type
Purchase Money Mortgage
Create a Home Valuation Report for This Property
The Home Valuation Report is an in-depth analysis detailing your home's value as well as a comparison with similar homes in the area
Home Values in the Area
Average Home Value in this Area
Purchase History
| Date | Buyer | Sale Price | Title Company |
|---|---|---|---|
| Sweeney Zachary D | $315,000 | First American Title Company | |
| Wharton Michelle Yvonne | $42,000 | First American | |
| West River Bend Lp | $577,000 | First American Title Ins Co |
Source: Public Records
Mortgage History
| Date | Status | Borrower | Loan Amount |
|---|---|---|---|
| Open | Sweeney Zachary D | $309,195 | |
| Previous Owner | Wharton Michelle Yvonne | $81,419 | |
| Previous Owner | West River Bend Lp | $8,000 |
Source: Public Records
Tax History Compared to Growth
Tax History
| Year | Tax Paid | Tax Assessment Tax Assessment Total Assessment is a certain percentage of the fair market value that is determined by local assessors to be the total taxable value of land and additions on the property. | Land | Improvement |
|---|---|---|---|---|
| 2025 | $4,057 | $358,302 | $71,662 | $286,640 |
| 2024 | $4,057 | $351,277 | $70,257 | $281,020 |
| 2023 | $4,021 | $344,389 | $68,879 | $275,510 |
| 2022 | $3,961 | $337,636 | $67,528 | $270,108 |
| 2021 | $3,870 | $331,016 | $66,204 | $264,812 |
| 2020 | $3,824 | $327,622 | $65,525 | $262,097 |
| 2019 | $3,753 | $321,198 | $64,240 | $256,958 |
| 2018 | $3,661 | $314,900 | $62,980 | $251,920 |
| 2017 | $3,218 | $274,151 | $52,414 | $221,737 |
| 2016 | $3,105 | $268,775 | $51,386 | $217,389 |
| 2015 | $2,884 | $249,000 | $50,000 | $199,000 |
| 2014 | $2,560 | $219,000 | $44,000 | $175,000 |
Source: Public Records
Map
Nearby Homes
- 18912 Shoshonee Rd
- 13411 Ivanpah Rd
- 13771 Wawona Rd
- 13501 Driftwood Dr
- 13395 Driftwood Dr
- 13380 Driftwood Dr
- 13262 Cuyamaca Rd
- 13770 Driftwood Dr
- 13550 Pyramid Dr
- 13240 Meteor Dr
- 18286 Lakeview Dr
- 18415 Niagara Dr
- 19220 Monterey St
- 19135 Monterey St
- 13139 Clipper Dr
- 19446 Shoshonee Rd
- 18715 Mingo Rd
- 13195 Trailwood Way
- 18160 Harbor Dr
- 13724 Chateau Ct
- 13717 Sahale Ct
- 0 Sahale Unit 315004267
- 0 Sahale Unit 335913
- 0 Sahale Unit P0-315004267
- 18888 Sahale Ln
- 18859 Sahale Ln
- 18826 Sahale Ln
- 13783 Sahale Ct
- 18873 Sahale Ln
- 18889 Sahale Ln
- 13768 Sahale Ct
- 18827 Sahale Ln
- 13746 Havasu Rd
- 18810 Sahale Ln
- 13782 Sahale Ct
- 13766 Havasu Rd
- 13789 Sahale Ct
- 13780 Havasu Rd
- 13795 Sahale Ct