M
Seller's Agent in 2020
Malia Bumgarner
Creed Noah Real Estate Company
(208) 859-5036
25 in this area
68 Total Sales


Estimated Value: $328,000 - $414,000
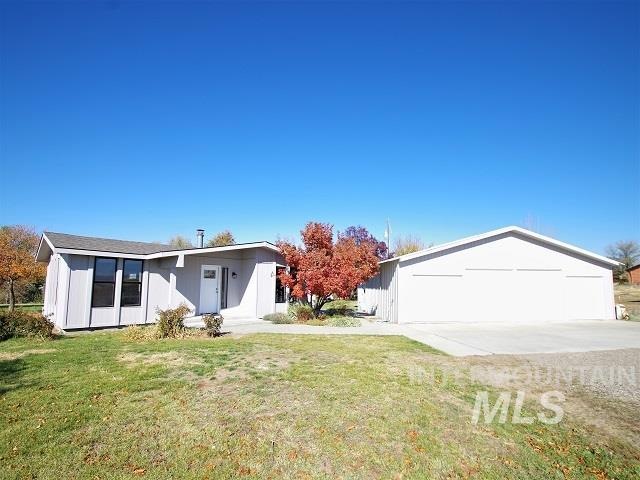
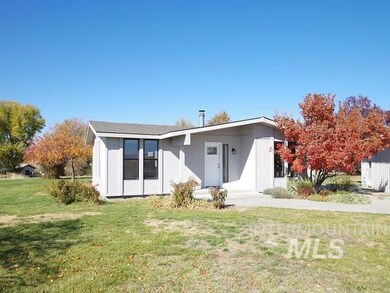
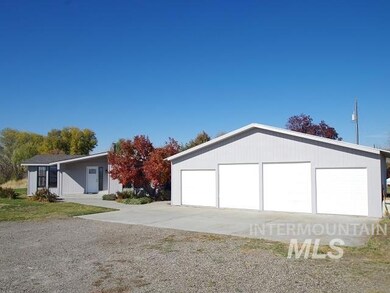
This home is located at 1375 E 11th St, Weiser, ID 83672 since 29 October 2019 and is currently estimated at $371,655, approximately $193 per square foot. This property was built in 1979. 1375 E 11th St is a home located in Washington County with nearby schools including Pioneer Primary School, Park Intermediate School, and Weiser Middle School.
Last Agent to Sell the Property
Creed Noah Real Estate Company Listed on: 10/29/2019
Co-Listed By
Creed Noah
Creed Noah Real Estate Company
| Date | Event | Price | List to Sale | Price per Sq Ft |
|---|---|---|---|---|
| 05/11/2020 05/11/20 | Sold | -- | -- | -- |
| 05/06/2020 05/06/20 | Pending | -- | -- | -- |
| 04/30/2020 04/30/20 | For Sale | $265,000 | 0.0% | $138 / Sq Ft |
| 04/30/2020 04/30/20 | Off Market | -- | -- | -- |
| 04/06/2020 04/06/20 | For Sale | $265,000 | 0.0% | $138 / Sq Ft |
| 01/15/2020 01/15/20 | Pending | -- | -- | -- |
| 10/29/2019 10/29/19 | For Sale | $265,000 | -- | $138 / Sq Ft |
| Year | Tax Paid | Tax Assessment Tax Assessment Total Assessment is a certain percentage of the fair market value that is determined by local assessors to be the total taxable value of land and additions on the property. | Land | Improvement |
|---|---|---|---|---|
| 2025 | $743 | $218,428 | $77,600 | $140,828 |
| 2024 | $704 | $196,371 | $77,600 | $118,771 |
| 2023 | $571 | $179,971 | $77,600 | $102,371 |
| 2022 | $744 | $178,381 | $77,600 | $100,781 |
| 2021 | $717 | $143,769 | $54,518 | $89,251 |
| 2020 | $1,240 | $119,117 | $46,814 | $72,303 |
| 2019 | $1,007 | $102,300 | $46,814 | $55,486 |
| 2018 | $980 | $89,934 | $46,814 | $43,120 |
| 2017 | $604 | $102,300 | $46,814 | $55,486 |
| 2013 | $573 | $0 | $0 | $0 |
| 2011 | $621 | $0 | $0 | $0 |
M
Seller's Agent in 2020
Malia Bumgarner
Creed Noah Real Estate Company
(208) 859-5036
25 in this area
68 Total Sales
C
Seller Co-Listing Agent in 2020
Creed Noah
Creed Noah Real Estate Company

Buyer's Agent in 2020
Mindy Sands
Global Realty Northwest-Oregon
(208) 550-2413
10 in this area
71 Total Sales
Source: Intermountain MLS
MLS Number: 98748989
APN: RP11N05W286150
Disclaimer: Certain information contained herein is derived from information provided by parties other than Homes.com. All information provided is deemed reliable, but is not guaranteed to be accurate and should be independently verified.
![]() IDX information is provided exclusively for consumers’ personal, non-commercial use, that it may not be used for any purpose other than to identify prospective properties consumers may be interested in purchasing. IMLS does not assume any liability for missing or inaccurate data.
IDX information is provided exclusively for consumers’ personal, non-commercial use, that it may not be used for any purpose other than to identify prospective properties consumers may be interested in purchasing. IMLS does not assume any liability for missing or inaccurate data.
Information provided by IMLS is deemed reliable but not guaranteed.
Ask me questions while you tour the home.