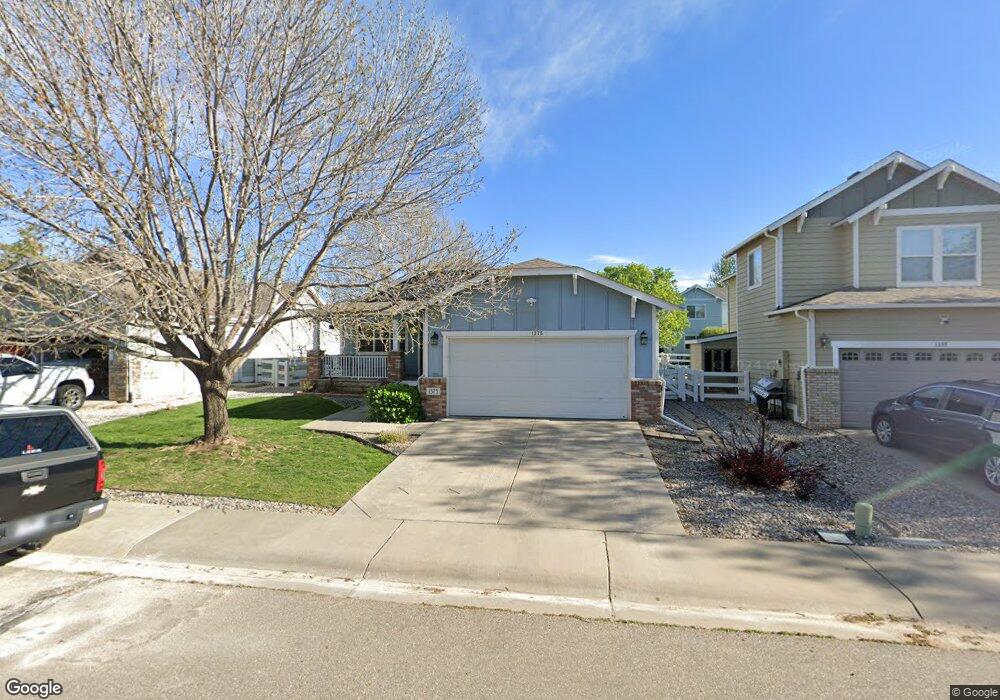
1375 Finch St Loveland, CO 80537
Estimated Value: $492,000 - $513,000
2
Beds
2
Baths
1,408
Sq Ft
$359/Sq Ft
Est. Value
About This Home
This home is located at 1375 Finch St, Loveland, CO 80537 and is currently estimated at $504,800, approximately $358 per square foot. 1375 Finch St is a home located in Larimer County with nearby schools including Winona Elementary School, Peakview Academy at Conrad Ball, and Mountain View High School.
Ownership History
Date
Name
Owned For
Owner Type
Purchase Details
Closed on
Sep 10, 2003
Sold by
Renker Michael W and Pollender Calista M
Bought by
Renker Michael W and Renker Calista M
Current Estimated Value
Home Financials for this Owner
Home Financials are based on the most recent Mortgage that was taken out on this home.
Original Mortgage
$183,041
Outstanding Balance
$85,321
Interest Rate
6.31%
Mortgage Type
VA
Estimated Equity
$419,479
Purchase Details
Closed on
Nov 16, 2001
Sold by
Life Structures Llc
Bought by
Renker Michael W and Pollender Calista M
Home Financials for this Owner
Home Financials are based on the most recent Mortgage that was taken out on this home.
Original Mortgage
$180,643
Interest Rate
6.59%
Mortgage Type
VA
Purchase Details
Closed on
Nov 1, 2000
Sold by
Arbor Meadows Llc
Bought by
Life Structures Llc
Home Financials for this Owner
Home Financials are based on the most recent Mortgage that was taken out on this home.
Original Mortgage
$84,750
Interest Rate
7.87%
Create a Home Valuation Report for This Property
The Home Valuation Report is an in-depth analysis detailing your home's value as well as a comparison with similar homes in the area
Home Values in the Area
Average Home Value in this Area
Purchase History
| Date | Buyer | Sale Price | Title Company |
|---|---|---|---|
| Renker Michael W | -- | -- | |
| Renker Michael W | $177,101 | Stewart Title | |
| Life Structures Llc | $114,854 | North American Title |
Source: Public Records
Mortgage History
| Date | Status | Borrower | Loan Amount |
|---|---|---|---|
| Open | Renker Michael W | $183,041 | |
| Closed | Renker Michael W | $180,643 | |
| Previous Owner | Life Structures Llc | $84,750 | |
| Closed | Life Structures Llc | $23,465 |
Source: Public Records
Tax History Compared to Growth
Tax History
| Year | Tax Paid | Tax Assessment Tax Assessment Total Assessment is a certain percentage of the fair market value that is determined by local assessors to be the total taxable value of land and additions on the property. | Land | Improvement |
|---|---|---|---|---|
| 2025 | $2,466 | $34,579 | $3,350 | $31,229 |
| 2024 | $2,378 | $34,579 | $3,350 | $31,229 |
| 2022 | $2,121 | $26,653 | $3,475 | $23,178 |
| 2021 | $2,179 | $27,420 | $3,575 | $23,845 |
| 2020 | $2,059 | $25,897 | $3,575 | $22,322 |
| 2019 | $1,844 | $23,595 | $3,575 | $20,020 |
| 2018 | $1,682 | $20,441 | $3,600 | $16,841 |
| 2017 | $1,449 | $20,441 | $3,600 | $16,841 |
| 2016 | $1,304 | $17,775 | $3,980 | $13,795 |
| 2015 | $1,293 | $17,770 | $3,980 | $13,790 |
| 2014 | $1,057 | $14,050 | $3,980 | $10,070 |
Source: Public Records
Map
Nearby Homes
- 1270 Inca Dove Cir
- 1238 Finch St
- 1465 Peacock Place
- 1523 Peacock Place
- 432 Cardinal Ave
- 445 Wrybill Ct
- 1510 E 1st St
- 1208 Raven Place
- 1064 E 1st St
- 332 Madison Ave
- 398 Blue Azurite Ave
- 1502 E 5th St
- 393 Lavastone Ave
- 1144 E 5th St
- 1053 E 5th St
- 2306 E 1st St
- 1343 E 7th St Unit 1
- 199 S Jefferson Ave Unit 205
- 715 E 4th St
- 108 S Jefferson Ave