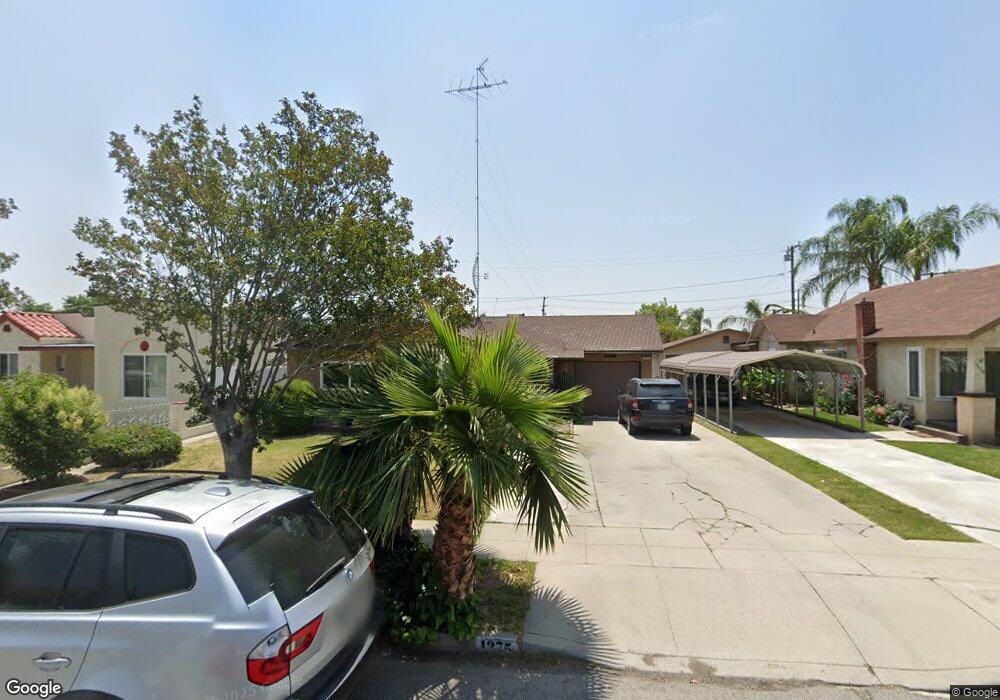
1375 Reece St San Bernardino, CA 92411
Mount Vernon NeighborhoodEstimated Value: $368,000 - $425,000
3
Beds
2
Baths
1,011
Sq Ft
$396/Sq Ft
Est. Value
About This Home
This home is located at 1375 Reece St, San Bernardino, CA 92411 and is currently estimated at $399,994, approximately $395 per square foot. 1375 Reece St is a home located in San Bernardino County with nearby schools including Graciano Gomez Elementary, Dr. Martin Luther King Jr. Middle School, and Arroyo Valley High School.
Ownership History
Date
Name
Owned For
Owner Type
Purchase Details
Closed on
Feb 20, 2019
Sold by
Alla Praveen
Bought by
Alla Praveen R and Sanagala Sirisha
Current Estimated Value
Purchase Details
Closed on
Jun 8, 2018
Sold by
Vayineni Kondala
Bought by
Vayineni Kondala and Sandur Sharadhra
Purchase Details
Closed on
Mar 18, 2016
Sold by
Sanagala Sirisha
Bought by
Alla Praveen
Purchase Details
Closed on
Mar 17, 2016
Sold by
Moreno Pete
Bought by
Moreno Barbara
Purchase Details
Closed on
Mar 15, 2016
Sold by
Herrera Christine and Moreno Barbara
Bought by
Vayineni Kondala and Vayineni Alla Praveen
Purchase Details
Closed on
Aug 15, 2015
Sold by
Gomez Jennie and Castruita Gloria
Bought by
Herrera Christine and Moreno Barbara
Purchase Details
Closed on
Jun 13, 2005
Sold by
Gomez Jennie
Bought by
Gloria Gomez Jennie and Gloria Castriuta
Create a Home Valuation Report for This Property
The Home Valuation Report is an in-depth analysis detailing your home's value as well as a comparison with similar homes in the area
Home Values in the Area
Average Home Value in this Area
Purchase History
| Date | Buyer | Sale Price | Title Company |
|---|---|---|---|
| Alla Praveen R | -- | None Available | |
| Vayineni Kondala | -- | None Available | |
| Alla Praveen | -- | Ticor Title Company | |
| Vayineni Kondala | -- | Ticor Title Company | |
| Moreno Barbara | -- | Ticor Title Company | |
| Vayineni Kondala | $151,000 | Ticor Title Company | |
| Samaro Martha | -- | Ticor Title Company | |
| Herrera Christine | -- | Ticor Title Company | |
| Herrera Christine | -- | None Available | |
| Gloria Gomez Jennie | -- | -- |
Source: Public Records
Tax History Compared to Growth
Tax History
| Year | Tax Paid | Tax Assessment Tax Assessment Total Assessment is a certain percentage of the fair market value that is determined by local assessors to be the total taxable value of land and additions on the property. | Land | Improvement |
|---|---|---|---|---|
| 2025 | $2,357 | $178,754 | $53,271 | $125,483 |
| 2024 | $2,357 | $175,249 | $52,226 | $123,023 |
| 2023 | $2,298 | $171,813 | $51,202 | $120,611 |
| 2022 | $2,300 | $168,444 | $50,198 | $118,246 |
| 2021 | $2,302 | $165,141 | $49,214 | $115,927 |
| 2020 | $2,306 | $163,447 | $48,709 | $114,738 |
| 2019 | $2,239 | $160,242 | $47,754 | $112,488 |
| 2018 | $2,215 | $157,100 | $46,818 | $110,282 |
| 2017 | $2,147 | $154,020 | $45,900 | $108,120 |
| 2016 | $508 | $27,700 | $4,526 | $23,174 |
| 2015 | $274 | $27,284 | $4,458 | $22,826 |
| 2014 | $264 | $26,750 | $4,371 | $22,379 |
Source: Public Records
Map
Nearby Homes
- 0 N Mt Vernon Ave Unit OC25230729
- 1263 N Mount Vernon Ave
- 1549 W 11th St
- 1256 W Base Line St
- 1263 W Baseline St
- 1098 N Mount Vernon Ave
- 1528 W Virginia St
- 1156 Ramona Ave
- 0 N Garner Ave
- 1202 W 11th St
- 984 N Pico Ave
- 1364 W 15th St
- 1190 W 14th St
- 0 Cabrera Ave Unit IV25244415
- 1424 W 16th St
- 1278 Perris St
- 1812 W Base Line St
- 796 N Mount Vernon Ave
- 852 N Davidson Ave
- 1287 W 8th St
- 1363 Reece St
- 1379 Reece St
- 1355 Reece St
- 1387 Reece St
- 1380 W Base Line St
- 1349 Reece St
- 1386 W Base Line St
- 1364 W Base Line St
- 1372 Reece St
- 1380 Reece St
- 1364 Reece St
- 1388 Reece St
- 1345 Reece St
- 1356 W Base Line St
- 1396 Reece St
- 1356 Reece St
- 1340 W Base Line St
- 1348 Reece St
- 1263 N Pico Ave
- 1400 W Base Line St