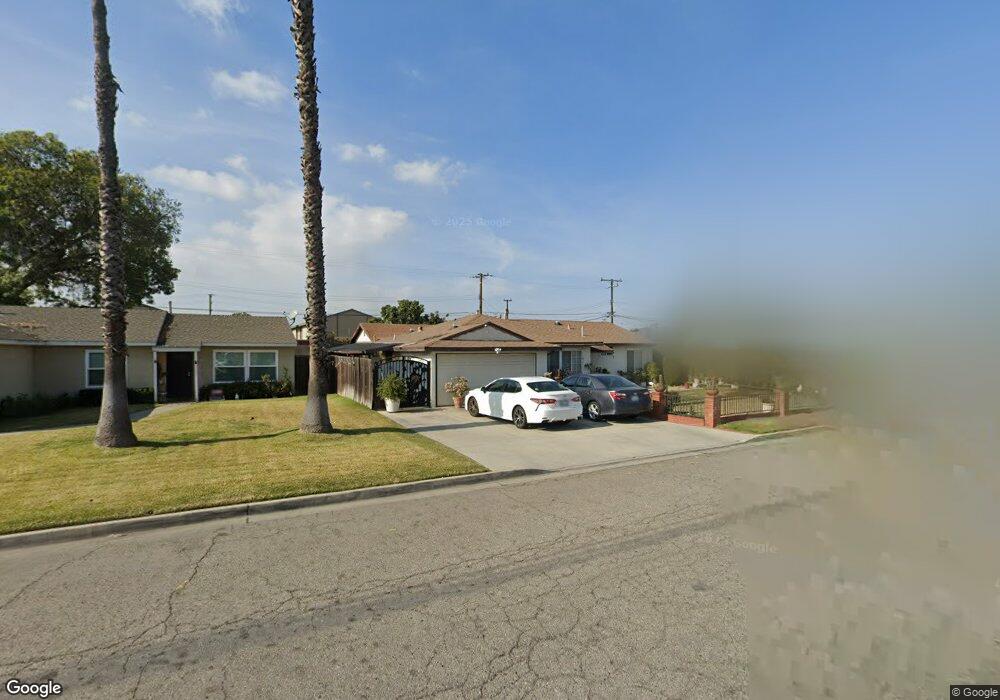
13751 Riata St Garden Grove, CA 92844
Estimated Value: $914,000 - $1,157,000
3
Beds
3
Baths
1,925
Sq Ft
$556/Sq Ft
Est. Value
About This Home
This home is located at 13751 Riata St, Garden Grove, CA 92844 and is currently estimated at $1,070,805, approximately $556 per square foot. 13751 Riata St is a home located in Orange County with nearby schools including Anderson Elementary School, Warner Middle, and Westminster High School.
Ownership History
Date
Name
Owned For
Owner Type
Purchase Details
Closed on
Aug 19, 2023
Sold by
Thong Thach Kinh and Thong Terry
Bought by
Thach And Terry Thong Family Trust and Thong
Current Estimated Value
Purchase Details
Closed on
Feb 20, 2003
Sold by
Thong Thach Kinh
Bought by
Thong Thach Kinh and Thong Terry
Purchase Details
Closed on
Mar 3, 2001
Sold by
Tong Terry
Bought by
Thong Thach Kinh
Home Financials for this Owner
Home Financials are based on the most recent Mortgage that was taken out on this home.
Original Mortgage
$125,000
Interest Rate
7.12%
Purchase Details
Closed on
Aug 22, 2000
Sold by
Senh Thong Pau and Senh Ngoc Tran
Bought by
Thong Thach Kinh
Purchase Details
Closed on
Feb 22, 1994
Sold by
Reipold James Henry and Reipold Barbara Ann
Bought by
Thong Pau Senh and Luong Tran Ngoc
Home Financials for this Owner
Home Financials are based on the most recent Mortgage that was taken out on this home.
Original Mortgage
$132,000
Interest Rate
7.21%
Create a Home Valuation Report for This Property
The Home Valuation Report is an in-depth analysis detailing your home's value as well as a comparison with similar homes in the area
Home Values in the Area
Average Home Value in this Area
Purchase History
| Date | Buyer | Sale Price | Title Company |
|---|---|---|---|
| Thach And Terry Thong Family Trust | -- | None Listed On Document | |
| Thong Thach Kinh | -- | -- | |
| Thong Thach Kinh | -- | Fidelity National Title Ins | |
| Thong Thach Kinh | -- | -- | |
| Thong Pau Senh | $160,000 | United Title Company |
Source: Public Records
Mortgage History
| Date | Status | Borrower | Loan Amount |
|---|---|---|---|
| Previous Owner | Thong Thach Kinh | $125,000 | |
| Previous Owner | Thong Pau Senh | $132,000 |
Source: Public Records
Tax History Compared to Growth
Tax History
| Year | Tax Paid | Tax Assessment Tax Assessment Total Assessment is a certain percentage of the fair market value that is determined by local assessors to be the total taxable value of land and additions on the property. | Land | Improvement |
|---|---|---|---|---|
| 2025 | $5,369 | $393,078 | $242,094 | $150,984 |
| 2024 | $5,369 | $385,371 | $237,347 | $148,024 |
| 2023 | $5,188 | $377,815 | $232,693 | $145,122 |
| 2022 | $5,097 | $370,407 | $228,130 | $142,277 |
| 2021 | $4,990 | $363,145 | $223,657 | $139,488 |
| 2020 | $4,932 | $359,422 | $221,364 | $138,058 |
| 2019 | $4,836 | $352,375 | $217,024 | $135,351 |
| 2018 | $4,821 | $345,466 | $212,768 | $132,698 |
| 2017 | $4,644 | $338,693 | $208,596 | $130,097 |
| 2016 | $4,470 | $332,052 | $204,505 | $127,547 |
| 2015 | $4,391 | $327,065 | $201,433 | $125,632 |
| 2014 | $4,296 | $320,659 | $197,487 | $123,172 |
Source: Public Records
Map
Nearby Homes
- 13782 Newland St
- 8784 Hewitt Place Unit 12
- 8442 Trask Ave
- 8202 19th St
- 8196 18th St
- 13839 Magnolia St
- 8197 Jasmine Ave
- 13252 Newland St Unit A-D
- 13402 Wynant Dr
- 13502 Jackson St
- 13411 Magnolia St
- 8741 Jennrich Ave
- 8520 Lake Knoll Ave Unit B
- 13392 Magnolia St
- 13175 Creek View Dr Unit F
- 8866 Grandville Cir
- 9200 Westminster Blvd Unit 25
- 7891 18th St
- 8902 Mcclure Ave
- 13141 Monroe St
- 13761 Riata St
- 13741 Riata St
- 13781 Riata St
- 8582 Mays Ave
- 8562 Mays Ave
- 13752 Riata St
- 13791 Riata St
- 13742 Riata St
- 8552 Mays Ave
- 13732 Riata St
- 13782 Riata St
- 13784 Newland St Unit B
- 13784 Newland St
- 8532 Mays Ave
- 13801 Riata St
- 13788 Newland St Unit B
- 13792 Riata St
- 13722 Riata St
- 8611 Lariat Ave
- 8522 Mays Ave