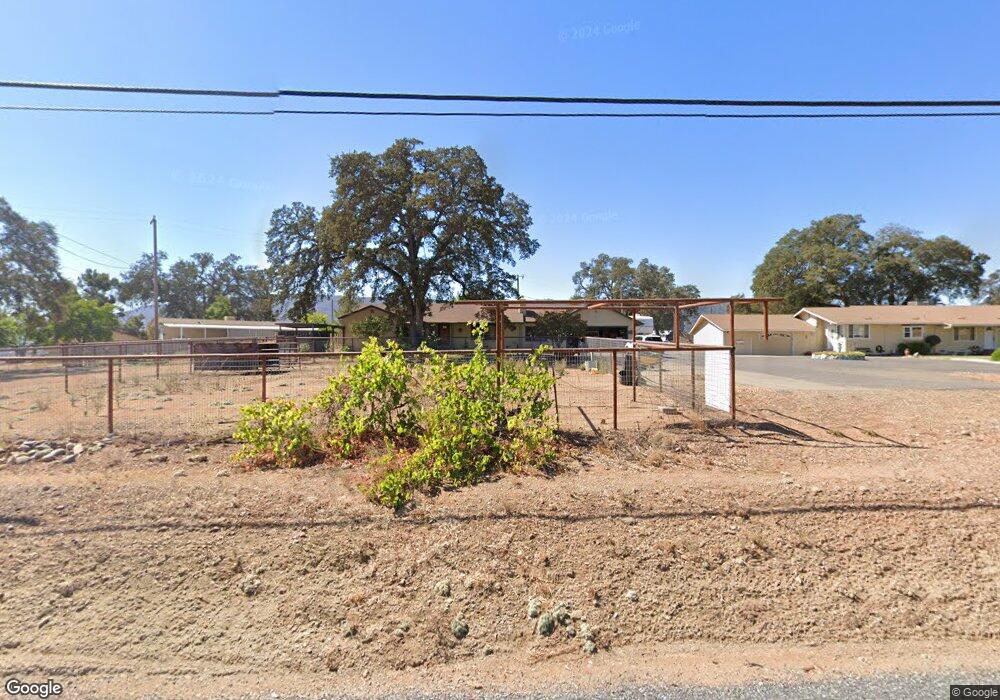
1376 Highway 49 San Andreas, CA 95249
Estimated Value: $362,000 - $396,000
3
Beds
1
Bath
1,820
Sq Ft
$210/Sq Ft
Est. Value
About This Home
This home is located at 1376 Highway 49, San Andreas, CA 95249 and is currently estimated at $381,291, approximately $209 per square foot. 1376 Highway 49 is a home with nearby schools including Jackson Elementary School, Jackson Junior High School, and Argonaut High School.
Ownership History
Date
Name
Owned For
Owner Type
Purchase Details
Closed on
Dec 19, 2023
Sold by
Harper Karen and Harper Jan
Bought by
Harper Ryan and Harper Emily
Current Estimated Value
Home Financials for this Owner
Home Financials are based on the most recent Mortgage that was taken out on this home.
Original Mortgage
$204,000
Outstanding Balance
$200,614
Interest Rate
7.5%
Mortgage Type
New Conventional
Estimated Equity
$180,677
Purchase Details
Closed on
May 11, 2017
Sold by
Long George P and Long Annie C
Bought by
Harper Karen and Harper Jan
Home Financials for this Owner
Home Financials are based on the most recent Mortgage that was taken out on this home.
Original Mortgage
$180,000
Interest Rate
4.14%
Mortgage Type
New Conventional
Purchase Details
Closed on
Sep 12, 2009
Sold by
Dougherty Kathy I and Harper Jan E
Bought by
Long George P and Long Annie C
Purchase Details
Closed on
May 12, 2009
Sold by
Dougherty Kathy I and Harper Karen E
Bought by
Long George P and Dougherty Kathy I
Create a Home Valuation Report for This Property
The Home Valuation Report is an in-depth analysis detailing your home's value as well as a comparison with similar homes in the area
Home Values in the Area
Average Home Value in this Area
Purchase History
| Date | Buyer | Sale Price | Title Company |
|---|---|---|---|
| Harper Ryan | $360,000 | Cornerstone Title | |
| Harper Karen | $225,000 | Placer Title Company | |
| Long George P | -- | None Available | |
| Long George P | -- | None Available |
Source: Public Records
Mortgage History
| Date | Status | Borrower | Loan Amount |
|---|---|---|---|
| Open | Harper Ryan | $204,000 | |
| Previous Owner | Harper Karen | $180,000 |
Source: Public Records
Tax History Compared to Growth
Tax History
| Year | Tax Paid | Tax Assessment Tax Assessment Total Assessment is a certain percentage of the fair market value that is determined by local assessors to be the total taxable value of land and additions on the property. | Land | Improvement |
|---|---|---|---|---|
| 2025 | $3,570 | $367,200 | $40,800 | $326,400 |
| 2023 | $3,140 | $246,068 | $43,744 | $202,324 |
| 2022 | $3,070 | $241,244 | $42,887 | $198,357 |
| 2021 | $2,844 | $236,515 | $42,047 | $194,468 |
| 2020 | $2,727 | $234,090 | $41,616 | $192,474 |
| 2019 | $1,265 | $95,885 | $33,099 | $62,786 |
| 2018 | $1,215 | $94,005 | $32,450 | $61,555 |
| 2017 | $1,191 | $92,163 | $31,814 | $60,349 |
| 2016 | $1,191 | $90,357 | $31,191 | $59,166 |
| 2015 | -- | $89,001 | $30,723 | $58,278 |
| 2014 | -- | $87,259 | $30,122 | $57,137 |
Source: Public Records
Map
Nearby Homes
- 1221 Magers Rd
- 1019 Highway 49
- 1330 Calaveritas Rd Unit 100
- 1330 Calaveritas Rd
- 507 Toyanza Dr
- 0 Angels Rd
- 607 Mountain Ranch Rd Unit 7
- 607 Mountain Ranch Rd Unit 2
- 1459 Gold Hunter Rd
- 504 Angels Rd
- 2800 Willow Creek Rd
- 443 Lewis Ave
- 109 Gatewood Ave
- 355 Lewis Ave
- 2806 California 49
- 68 Church Hill Rd
- 441 Sunset St
- 23 W Saint Charles St
- 213 Main Street Lot #14
- 213 Main St
- 1435 Howell Rd
- 1368 Highway 49
- 1453 Highway 49
- 1301 Howell Rd
- 1460 California 49
- 1016 Magers Rd
- 1220 Howell Rd
- 0 Buckskin Way
- 1016 Magers Way
- 1496 Highway 49
- 1496 Highway 49
- 1232 Howell Rd
- 1082 Magers Rd
- 1500 Saddleback Dr Unit 7
- 1500 Saddleback Dr
- 1385 Saddleback Dr
- 1639 O Connell Ln
- 1473 Saddleback Dr
- 1180 Magers Rd Unit 15006154
- 1180 Magers Rd Unit 13007762