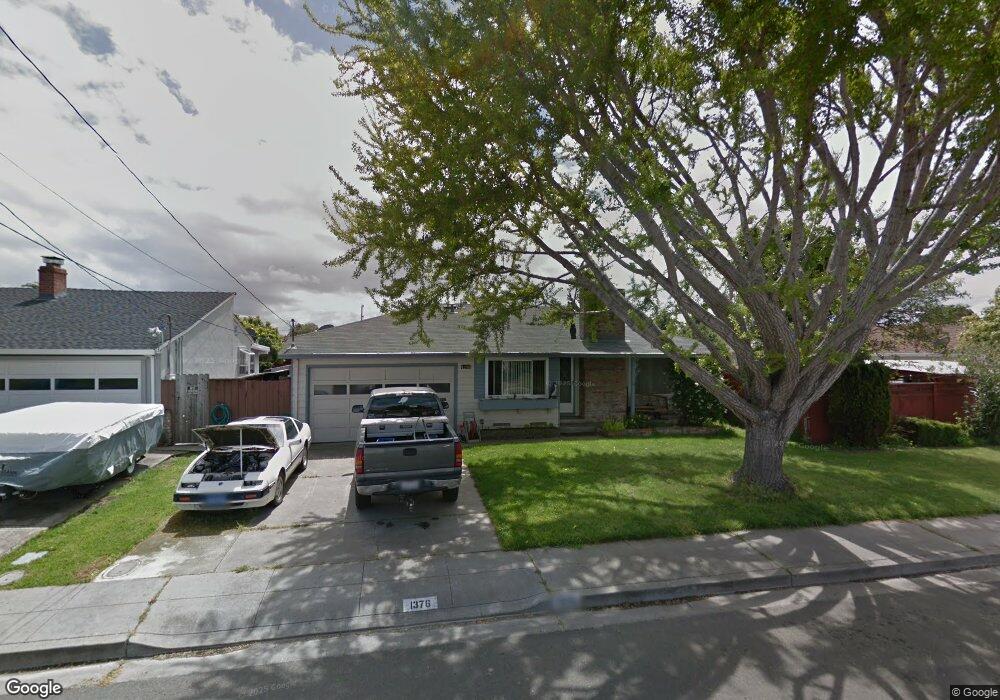
1376 Via Faisan San Lorenzo, CA 94580
Estimated Value: $903,000 - $945,514
4
Beds
2
Baths
1,414
Sq Ft
$651/Sq Ft
Est. Value
About This Home
This home is located at 1376 Via Faisan, San Lorenzo, CA 94580 and is currently estimated at $920,879, approximately $651 per square foot. 1376 Via Faisan is a home located in Alameda County with nearby schools including Bay Elementary School, Bohannon Middle School, and Arroyo High School.
Ownership History
Date
Name
Owned For
Owner Type
Purchase Details
Closed on
Mar 14, 2018
Sold by
Larson Phyllis and The 2017 Larson Revocable Livi
Bought by
Chen Shi Ning and Zhong Changrong
Current Estimated Value
Home Financials for this Owner
Home Financials are based on the most recent Mortgage that was taken out on this home.
Original Mortgage
$470,000
Outstanding Balance
$402,178
Interest Rate
4.32%
Mortgage Type
New Conventional
Estimated Equity
$518,701
Purchase Details
Closed on
Mar 30, 2017
Sold by
Larson David K and Larson Phyllis L
Bought by
Larson David and Larson Phyllis
Purchase Details
Closed on
Oct 30, 1998
Sold by
Lucas Robert E Trust and Allen Scott
Bought by
Larson David K and Larson Phyllis L
Home Financials for this Owner
Home Financials are based on the most recent Mortgage that was taken out on this home.
Original Mortgage
$199,500
Interest Rate
6.54%
Create a Home Valuation Report for This Property
The Home Valuation Report is an in-depth analysis detailing your home's value as well as a comparison with similar homes in the area
Home Values in the Area
Average Home Value in this Area
Purchase History
| Date | Buyer | Sale Price | Title Company |
|---|---|---|---|
| Chen Shi Ning | $760,000 | North American Title Comp | |
| Larson David | -- | None Available | |
| Larson David K | $210,000 | Fidelity National Title Co |
Source: Public Records
Mortgage History
| Date | Status | Borrower | Loan Amount |
|---|---|---|---|
| Open | Chen Shi Ning | $470,000 | |
| Previous Owner | Larson David K | $199,500 |
Source: Public Records
Tax History Compared to Growth
Tax History
| Year | Tax Paid | Tax Assessment Tax Assessment Total Assessment is a certain percentage of the fair market value that is determined by local assessors to be the total taxable value of land and additions on the property. | Land | Improvement |
|---|---|---|---|---|
| 2025 | $10,909 | $869,109 | $259,420 | $609,689 |
| 2024 | $10,909 | $852,068 | $254,334 | $597,734 |
| 2023 | $11,095 | $835,362 | $249,347 | $586,015 |
| 2022 | $10,698 | $818,986 | $244,459 | $574,527 |
| 2021 | $10,414 | $802,929 | $239,666 | $563,263 |
| 2020 | $10,445 | $794,703 | $237,211 | $557,492 |
| 2019 | $10,186 | $775,200 | $232,560 | $542,640 |
| 2018 | $3,957 | $289,328 | $86,798 | $202,530 |
| 2017 | $3,778 | $283,657 | $85,097 | $198,560 |
| 2016 | $3,601 | $278,096 | $83,429 | $194,667 |
| 2015 | $3,521 | $273,918 | $82,175 | $191,743 |
| 2014 | $3,468 | $268,554 | $80,566 | $187,988 |
Source: Public Records
Map
Nearby Homes
- 1338 Via la Paloma
- 1631 Via Ventana
- 1655 Via Escondido
- 0 E 14th St Unit 41059501
- 1575 Via Lucas
- 1311 Via Manzanas
- 15967 Paseo Del Campo
- 16050 Via Olinda
- 1608 Keller Ave
- 1781 Via Rancho
- 17069 Via Chiquita
- 1766 Via Redondo
- 16011 Via Conejo
- 15771 Via Nueva
- 987 Via Bregani
- 840 Woodgate Dr
- 638 Paseo Del Rio
- 874 Lewelling Blvd
- 17354 Via el Cerrito
- 15382 Andover St
- 1364 Via Faisan
- 16028 Via Anade
- 16020 Via Anade
- 1356 Via Faisan
- 16036 Via Anade
- 1381 Via la Paloma
- 1369 Via la Paloma
- 1383 Via Faisan
- 1367 Via Faisan
- 1348 Via Faisan
- 1357 Via la Paloma
- 16044 Via Anade
- 1359 Via Faisan
- 1391 Via Faisan
- 1345 Via la Paloma
- 16027 Via Anade
- 16019 Via Anade
- 1351 Via Faisan
- 1338 Via Faisan
- 16035 Via Anade