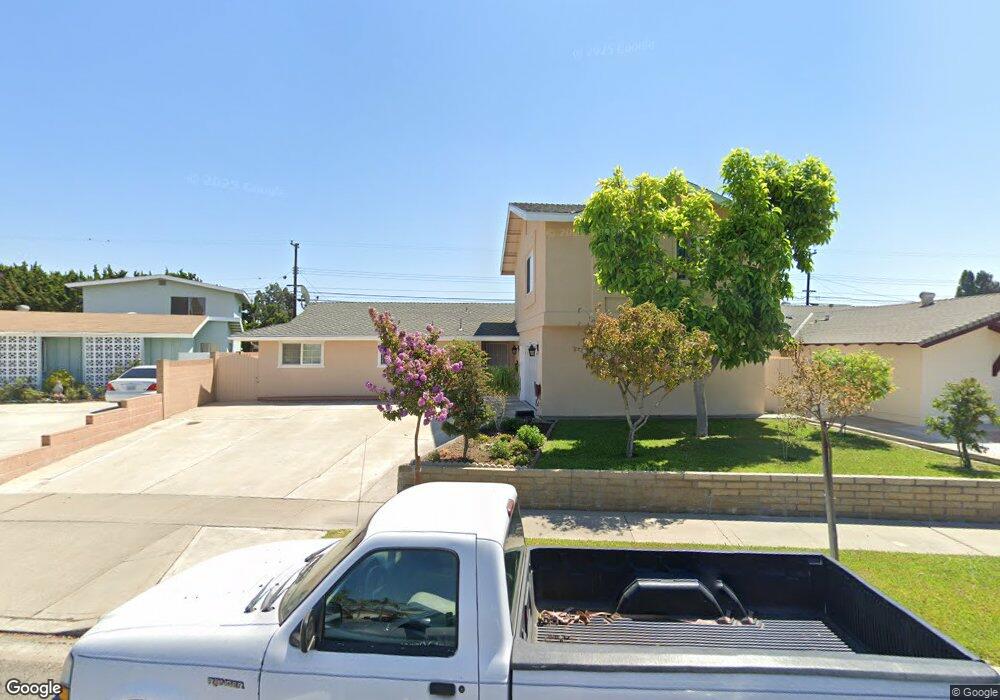
13762 Cork St Garden Grove, CA 92844
Estimated Value: $1,001,000 - $1,271,000
5
Beds
4
Baths
2,441
Sq Ft
$474/Sq Ft
Est. Value
About This Home
This home is located at 13762 Cork St, Garden Grove, CA 92844 and is currently estimated at $1,157,647, approximately $474 per square foot. 13762 Cork St is a home located in Orange County with nearby schools including Cook Elementary School, Donald S. Jordan Intermediate School, and Bolsa Grande High School.
Ownership History
Date
Name
Owned For
Owner Type
Purchase Details
Closed on
Jul 5, 2011
Sold by
Lai Christopher Chien and Lai Lawrence Lam Van
Bought by
Lai Lori Thu and Lai Lawrence Lam Van
Current Estimated Value
Purchase Details
Closed on
Apr 28, 2005
Sold by
Lai Christopher Chien
Bought by
Lai Christopher Chien and Lai Lawrence Lam Van
Purchase Details
Closed on
Sep 23, 2001
Sold by
Dinh Dung Hung and Lai Loan Thi
Bought by
Lai Christopher Chien
Purchase Details
Closed on
Mar 25, 1999
Sold by
Dinh Dung Hung and Lai Loan Thi
Bought by
Dinh Dung Hung and Lai Loan Thi
Purchase Details
Closed on
Jan 22, 1996
Sold by
Vanvannguyen Thong Van and Nguyen Hao Thi
Bought by
Dinh Dung Hung and Lai Loan Thi
Home Financials for this Owner
Home Financials are based on the most recent Mortgage that was taken out on this home.
Original Mortgage
$104,000
Interest Rate
7.25%
Create a Home Valuation Report for This Property
The Home Valuation Report is an in-depth analysis detailing your home's value as well as a comparison with similar homes in the area
Home Values in the Area
Average Home Value in this Area
Purchase History
| Date | Buyer | Sale Price | Title Company |
|---|---|---|---|
| Lai Lori Thu | -- | None Available | |
| Lai Christopher Chien | -- | -- | |
| Lai Christopher Chien | -- | -- | |
| Dinh Dung Hung | -- | -- | |
| Dinh Dung Hung | $154,000 | Landwood Title Company |
Source: Public Records
Mortgage History
| Date | Status | Borrower | Loan Amount |
|---|---|---|---|
| Closed | Dinh Dung Hung | $104,000 |
Source: Public Records
Tax History Compared to Growth
Tax History
| Year | Tax Paid | Tax Assessment Tax Assessment Total Assessment is a certain percentage of the fair market value that is determined by local assessors to be the total taxable value of land and additions on the property. | Land | Improvement |
|---|---|---|---|---|
| 2025 | $7,060 | $581,549 | $408,219 | $173,330 |
| 2024 | $7,060 | $570,147 | $400,215 | $169,932 |
| 2023 | $6,930 | $558,968 | $392,368 | $166,600 |
| 2022 | $6,782 | $548,008 | $384,674 | $163,334 |
| 2021 | $6,709 | $537,263 | $377,131 | $160,132 |
| 2020 | $6,619 | $531,755 | $373,264 | $158,491 |
| 2019 | $6,489 | $521,329 | $365,945 | $155,384 |
| 2018 | $6,358 | $511,107 | $358,769 | $152,338 |
| 2017 | $6,269 | $501,086 | $351,735 | $149,351 |
| 2016 | $5,955 | $491,261 | $344,838 | $146,423 |
| 2015 | $5,871 | $483,882 | $339,658 | $144,224 |
| 2014 | $5,728 | $474,404 | $333,005 | $141,399 |
Source: Public Records
Map
Nearby Homes
- 10061 15th St
- 14171 Flower St
- 13262 Verde St
- 9906 13th St
- 9691 Central Ave
- 10002 Central Ave Unit 26
- 10002 Central Ave Unit 27
- 10002 Central Ave
- 10002 Central Ave Unit 25
- 9931 Central Ave
- 9200 Westminster Blvd Unit 25
- 9651 Crosby Ave
- 9884 11th St
- 14362 Bushard St Unit 39
- 14362 Bushard St Unit 109
- 9141 Jennrich Ave
- 13839 Magnolia St
- 13711 Magnolia St
- 13392 Magnolia St
- 13100 Gilbert St Unit 28
- 13772 Cork St
- 13752 Cork St
- 13792 Cork St
- 9711 Blake Ave
- 13771 Cork St
- 13802 Cork St
- 9701 Blake Ave
- 9701 Mansor Ave
- 9692 Blake Ave
- 9691 Blake Ave
- 9732 Woodbury Ave
- 13812 Cork St
- 9722 Woodbury Ave
- 9691 Mansor Ave
- 9712 Woodbury Ave
- 9682 Blake Ave
- 9702 Woodbury Ave
- 9681 Blake Ave
- 13822 Cork St
- 9681 Mansor Ave