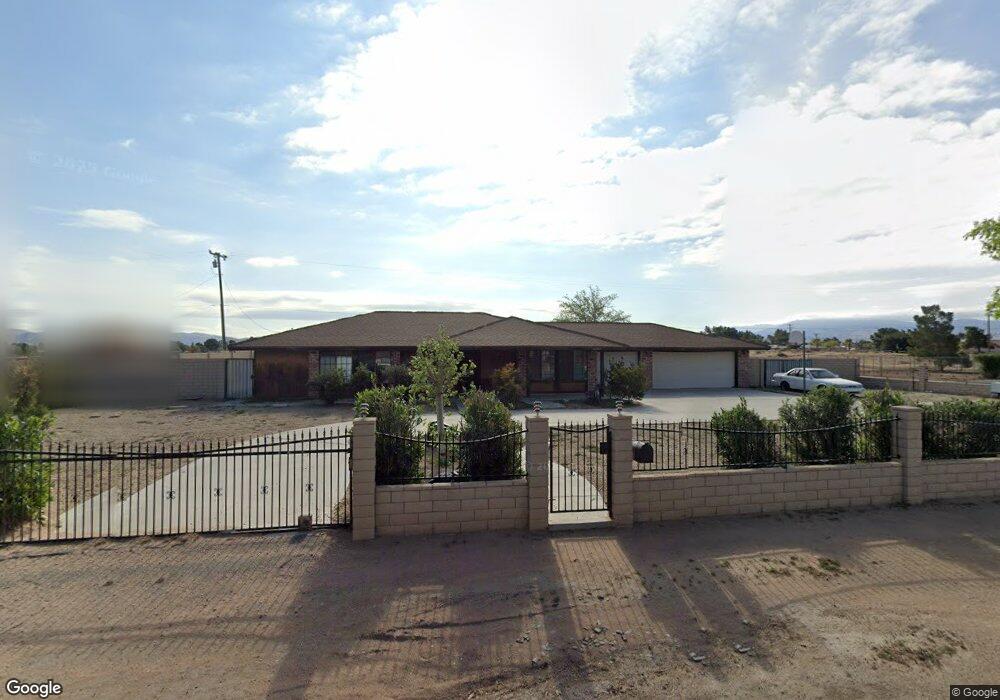
13767 Cree Rd Apple Valley, CA 92307
High Desert NeighborhoodEstimated Value: $425,683 - $487,000
3
Beds
2
Baths
1,823
Sq Ft
$253/Sq Ft
Est. Value
About This Home
This home is located at 13767 Cree Rd, Apple Valley, CA 92307 and is currently estimated at $460,921, approximately $252 per square foot. 13767 Cree Rd is a home located in San Bernardino County with nearby schools including Rio Vista School of Applied Learning, Granite Hills High School, and Apple Valley Christian.
Ownership History
Date
Name
Owned For
Owner Type
Purchase Details
Closed on
Jan 18, 2025
Sold by
Kendrick Dionisia
Bought by
Lucky Family Trust and Kendrick
Current Estimated Value
Purchase Details
Closed on
Jul 30, 2004
Sold by
Kendrick Ervin L
Bought by
Kendrick Ervin L and Kendrick Dionisia
Home Financials for this Owner
Home Financials are based on the most recent Mortgage that was taken out on this home.
Original Mortgage
$189,000
Interest Rate
7.8%
Mortgage Type
New Conventional
Purchase Details
Closed on
Nov 30, 1994
Sold by
Kendrick Dionisia C
Bought by
Kendrick Ervin L
Home Financials for this Owner
Home Financials are based on the most recent Mortgage that was taken out on this home.
Original Mortgage
$132,925
Interest Rate
9.27%
Mortgage Type
FHA
Purchase Details
Closed on
Nov 7, 1994
Sold by
Slusser Hale W
Bought by
Kendrick Ervin L
Home Financials for this Owner
Home Financials are based on the most recent Mortgage that was taken out on this home.
Original Mortgage
$132,925
Interest Rate
9.27%
Mortgage Type
FHA
Create a Home Valuation Report for This Property
The Home Valuation Report is an in-depth analysis detailing your home's value as well as a comparison with similar homes in the area
Home Values in the Area
Average Home Value in this Area
Purchase History
| Date | Buyer | Sale Price | Title Company |
|---|---|---|---|
| Lucky Family Trust | -- | None Listed On Document | |
| Kendrick Ervin L | -- | First American | |
| Kendrick Ervin L | -- | Old Republic Title Co | |
| Kendrick Ervin L | $140,545 | Old Republic Title Co |
Source: Public Records
Mortgage History
| Date | Status | Borrower | Loan Amount |
|---|---|---|---|
| Previous Owner | Kendrick Ervin L | $189,000 | |
| Previous Owner | Kendrick Ervin L | $132,925 |
Source: Public Records
Tax History
| Year | Tax Paid | Tax Assessment Tax Assessment Total Assessment is a certain percentage of the fair market value that is determined by local assessors to be the total taxable value of land and additions on the property. | Land | Improvement |
|---|---|---|---|---|
| 2025 | $3,076 | $264,562 | $77,269 | $187,293 |
| 2024 | $2,988 | $259,375 | $75,754 | $183,621 |
| 2023 | $2,960 | $254,290 | $74,269 | $180,021 |
| 2022 | $2,913 | $249,304 | $72,813 | $176,491 |
| 2021 | $2,845 | $244,415 | $71,385 | $173,030 |
| 2020 | $2,810 | $241,909 | $70,653 | $171,256 |
| 2019 | $2,757 | $237,166 | $69,268 | $167,898 |
| 2018 | $2,688 | $232,516 | $67,910 | $164,606 |
| 2017 | $2,649 | $227,956 | $66,578 | $161,378 |
| 2016 | $2,545 | $223,487 | $65,273 | $158,214 |
| 2015 | $2,506 | $220,130 | $64,293 | $155,837 |
| 2014 | $2,471 | $215,818 | $63,034 | $152,784 |
Source: Public Records
Map
Nearby Homes
- 13934 Okesa Rd
- 13991 Falling Leaf Rd
- 0 Shawnee Rd Unit HD25098149
- 20585 Yucca Loma Rd
- 14057 Crow Rd
- 20385 Eyota Rd
- 14024 Delaware Rd
- 19924 Sunset Ln
- 20635 Tonawanda Rd
- 13954 Cronese Rd
- 13519 Sunset Dr
- 19978 Eyota Rd
- 14265 Santee Rd
- 19891 Talihina Rd
- 20783 Shawnee Rd
- 20136 Ottawa Rd
- 13447 Iroquois Rd
- 20865 Tonawanda Rd
- 20401 Tonawanda Rd
- 19801 Talihina Rd
- 13787 Cree Rd
- 13739 Cree Rd
- 20260 Sahale Rd
- 13786 Cree Rd
- 13811 Cree Rd
- 20257 Sahale Rd
- 13802 Cree Rd
- 13721 Cree Rd
- 20236 Sahale Rd
- 13718 Cree Rd
- 13827 Cree Rd
- 20237 Sahale Rd
- 13824 Cree Rd
- 13807 Santee Rd
- 20236 Yucca Loma Rd
- 20216 Sahale Rd
- 13800 Santee Rd
- 13838 Cree Rd
- 13821 Santee Rd
- 20215 Sahale Rd
Your Personal Tour Guide
Ask me questions while you tour the home.