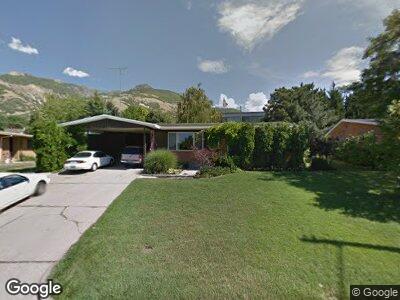
1377 Lark Cir Ogden, UT 84403
Mt Ogden NeighborhoodEstimated Value: $516,000 - $547,760
6
Beds
3
Baths
2,733
Sq Ft
$193/Sq Ft
Est. Value
About This Home
This home is located at 1377 Lark Cir, Ogden, UT 84403 and is currently estimated at $527,940, approximately $193 per square foot. 1377 Lark Cir is a home located in Weber County with nearby schools including Wasatch Elementary School, Mount Ogden Junior High School, and Ogden High School.
Ownership History
Date
Name
Owned For
Owner Type
Purchase Details
Closed on
Feb 10, 2021
Sold by
Hartford Joshua
Bought by
Hartford Joshua Samuel
Current Estimated Value
Home Financials for this Owner
Home Financials are based on the most recent Mortgage that was taken out on this home.
Original Mortgage
$315,727
Outstanding Balance
$287,709
Interest Rate
2.6%
Mortgage Type
New Conventional
Estimated Equity
$256,003
Purchase Details
Closed on
Mar 25, 2020
Sold by
Godfrey Sarah C and The Lynn And Melva Crookston T
Bought by
Hartford Joshua
Home Financials for this Owner
Home Financials are based on the most recent Mortgage that was taken out on this home.
Original Mortgage
$315,185
Interest Rate
3.4%
Mortgage Type
FHA
Purchase Details
Closed on
May 14, 2019
Sold by
Crookston Melva C
Bought by
Crookston Melva C and The Lynn And Melva Crookston T
Create a Home Valuation Report for This Property
The Home Valuation Report is an in-depth analysis detailing your home's value as well as a comparison with similar homes in the area
Home Values in the Area
Average Home Value in this Area
Purchase History
| Date | Buyer | Sale Price | Title Company |
|---|---|---|---|
| Hartford Joshua Samuel | -- | F1 Title Ins Agency Llc | |
| Hartford Joshua | -- | North Amer Ttl Ut Bountiful | |
| Crookston Melva C | -- | None Available |
Source: Public Records
Mortgage History
| Date | Status | Borrower | Loan Amount |
|---|---|---|---|
| Open | Hartford Joshua Samuel | $315,727 | |
| Closed | Hartford Joshua | $315,185 |
Source: Public Records
Tax History Compared to Growth
Tax History
| Year | Tax Paid | Tax Assessment Tax Assessment Total Assessment is a certain percentage of the fair market value that is determined by local assessors to be the total taxable value of land and additions on the property. | Land | Improvement |
|---|---|---|---|---|
| 2024 | $4,028 | $288,749 | $89,340 | $199,409 |
| 2023 | $3,559 | $255,750 | $80,615 | $175,135 |
| 2022 | $3,464 | $251,350 | $72,040 | $179,310 |
| 2021 | $3,004 | $357,000 | $69,874 | $287,126 |
| 2020 | $2,769 | $302,000 | $55,749 | $246,251 |
| 2019 | $2,669 | $272,000 | $50,657 | $221,343 |
| 2018 | $2,502 | $252,000 | $48,682 | $203,318 |
| 2017 | $2,318 | $216,000 | $48,682 | $167,318 |
| 2016 | $2,076 | $103,164 | $26,021 | $77,143 |
| 2015 | $1,792 | $85,078 | $26,021 | $59,057 |
| 2014 | $1,805 | $85,121 | $26,021 | $59,100 |
Source: Public Records
Map
Nearby Homes
- 1350 36th St
- 3614 Taylor Ave
- 1324 Kingston Dr
- 1516 36th St
- 3520 Kingston Cir
- 3714 Brinker Ave
- 3671 Eccles Ave
- 3711 Eccles Ave
- 4115 Edgehill Dr
- 968 Bel Mar Dr
- 1152 41st St
- 1054 34th St
- 1616 S Fowler Ave
- 3374 Eccles Ave
- 3315 Meadow Dr
- 985 39th St
- 4203 College Dr
- 3409 Jackson Ave
- 1320 Country Hills Dr
- 1229 E 33rd St