1377 Robbers Ravine Rd Colfax, CA 95713
Estimated Value: $519,000 - $903,000
About This Home
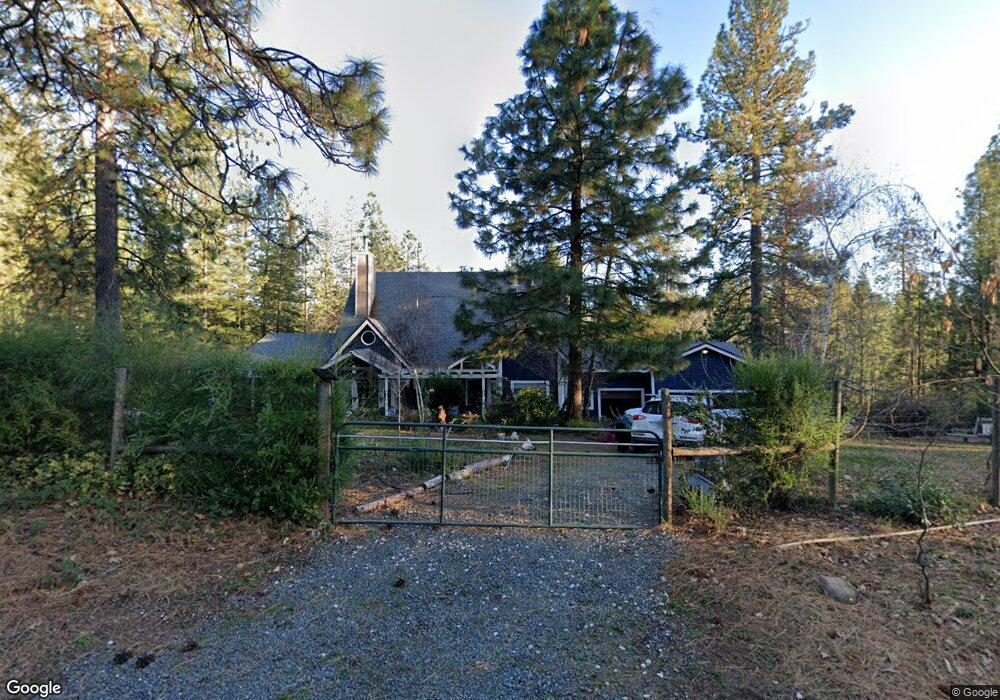
This home is located at 1377 Robbers Ravine Rd, Colfax, CA 95713 and is currently estimated at $677,762, approximately $248 per square foot. 1377 Robbers Ravine Rd is a home located in Placer County with nearby schools including Colfax Elementary School and Colfax High School.
Ownership History
We collect this data history from publicly available records. To have your information removed, we recommend requesting removal directly through your county’s website.
Purchase Details
Home Financials for this Owner
Home Financials are based on the most recent Mortgage that was taken out on this home.Purchase Details
Purchase Details
Home Financials for this Owner
Home Financials are based on the most recent Mortgage that was taken out on this home.Home Values in the Area
Average Home Value in this Area
Purchase History
We collect this data history from publicly available records. To have your information removed, we recommend requesting removal directly through your county’s website.
| Date | Buyer | Sale Price | Title Company |
|---|---|---|---|
| -- | Unisource | ||
| -- | None Available | ||
| $218,000 | Placer Title Company |
Mortgage History
We collect this data history from publicly available records. To have your information removed, we recommend requesting removal directly through your county’s website.
| Date | Status | Borrower | Loan Amount |
|---|---|---|---|
| Open | $391,900 | ||
| Closed | $196,200 |
Tax History
We collect this data history from publicly available records. To have your information removed, we recommend requesting removal directly through your county’s website.
| Year | Tax Paid | Tax Assessment Tax Assessment Total Assessment is a certain percentage of the fair market value that is determined by local assessors to be the total taxable value of land and additions on the property. | Land | Improvement |
|---|---|---|---|---|
| 2025 | $4,129 | $403,284 | $61,173 | $342,111 |
| 2023 | $4,129 | $387,626 | $58,799 | $328,827 |
| 2022 | $3,996 | $380,027 | $57,647 | $322,380 |
| 2021 | $3,911 | $372,576 | $56,517 | $316,059 |
| 2020 | $3,866 | $368,757 | $55,938 | $312,819 |
| 2019 | $3,790 | $361,528 | $54,842 | $306,686 |
| 2018 | $3,657 | $354,440 | $53,767 | $300,673 |
| 2017 | $3,592 | $347,491 | $52,713 | $294,778 |
| 2016 | $3,517 | $340,679 | $51,680 | $288,999 |
| 2015 | $3,432 | $335,562 | $50,904 | $284,658 |
| 2014 | $3,380 | $328,989 | $49,907 | $279,082 |
Map
- 0 Robbers Ravine Rd
- 26825 Rockrose Ln
- 26672 Old Loggers Ln
- 26650 Old Loggers Ln
- 26750 Rockrose Ln
- 26672 Old Logger Ln
- 0 Old Loggers Ln Unit 225126623
- 975 Dusty Rd
- 661 Cape Horn Rd E
- 0 Loggers Trail
- 0 Carpenter Rd Unit 225089482
- 0 Norton Grade Unit 225127018
- 26375 Barb Wire Ln
- 26355 Barb Wire Ln
- 26070 Green Acres Rd
- 450 Gladycon Rd Unit 41
- 450 Gladycon Rd Unit 32
- 450 Gladycon Rd Unit 52
- 450 Gladycon Rd Unit 44
- 450 Gladycon Rd Unit 3
- 1411 Robbers Ravine Rd
- 1345 Robbers Ravine Rd
- 525 Hideout Ln
- 1340 Robbers Ravine Rd
- 1455 Robbers Ravine Rd
- 475 Hideout Ln
- 1465 Robbers Ravine Rd
- 1330 Robbers Ravine Rd
- 445 Hideout Ln
- 440 Hideout Ln
- 1460 Dusty Rd
- 1480 Dusty Rd
- 1477 Robbers Ravine Rd
- 1321 Robbers Ravine Rd
- 1323 Robbers Ravine Rd
- 1460 Robbers Ravine Rd
- 1550 Dusty Rd
- 1500 Robbers Ravine Rd
- 430 Hideout Ln
- 1320 Robbers Ravine Rd
Ask me questions while you tour the home.