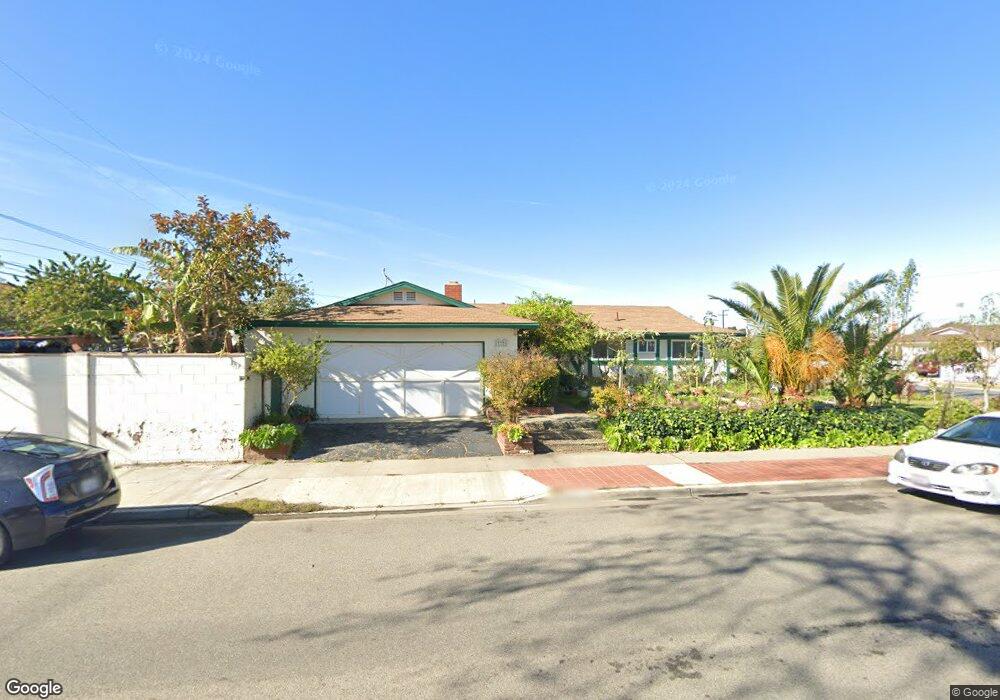
13771 Erin St Garden Grove, CA 92844
Estimated Value: $965,284 - $1,038,000
4
Beds
2
Baths
1,375
Sq Ft
$727/Sq Ft
Est. Value
About This Home
This home is located at 13771 Erin St, Garden Grove, CA 92844 and is currently estimated at $999,071, approximately $726 per square foot. 13771 Erin St is a home located in Orange County with nearby schools including Cook Elementary School, Donald S. Jordan Intermediate School, and Bolsa Grande High School.
Ownership History
Date
Name
Owned For
Owner Type
Purchase Details
Closed on
Mar 23, 2006
Sold by
Do James S and Ksor Michelle
Bought by
Do James S and Ksor Michelle
Current Estimated Value
Home Financials for this Owner
Home Financials are based on the most recent Mortgage that was taken out on this home.
Original Mortgage
$261,000
Interest Rate
6.25%
Mortgage Type
New Conventional
Purchase Details
Closed on
Aug 29, 2001
Sold by
Do Si
Bought by
Do Si and Ksor Hsen
Home Financials for this Owner
Home Financials are based on the most recent Mortgage that was taken out on this home.
Original Mortgage
$258,400
Interest Rate
7.09%
Purchase Details
Closed on
Aug 24, 2001
Sold by
Lam Vincence Y and Lam Phat Q
Bought by
Do Si
Home Financials for this Owner
Home Financials are based on the most recent Mortgage that was taken out on this home.
Original Mortgage
$258,400
Interest Rate
7.09%
Purchase Details
Closed on
Apr 28, 1998
Sold by
Ogletree Buddy E and Ogletree Jane Betty
Bought by
Lam Vincence Y and Lam Phat Q
Home Financials for this Owner
Home Financials are based on the most recent Mortgage that was taken out on this home.
Original Mortgage
$169,900
Interest Rate
7.13%
Create a Home Valuation Report for This Property
The Home Valuation Report is an in-depth analysis detailing your home's value as well as a comparison with similar homes in the area
Home Values in the Area
Average Home Value in this Area
Purchase History
| Date | Buyer | Sale Price | Title Company |
|---|---|---|---|
| Do James S | -- | First American Title | |
| Do Si | -- | -- | |
| Do Si | $272,000 | Fidelity National Title Ins | |
| Do Si | -- | Fidelity National Title Ins | |
| Lam Vincence Y | $190,000 | Southland Title Corporation |
Source: Public Records
Mortgage History
| Date | Status | Borrower | Loan Amount |
|---|---|---|---|
| Closed | Do James S | $261,000 | |
| Closed | Do Si | $258,400 | |
| Previous Owner | Lam Vincence Y | $169,900 |
Source: Public Records
Tax History Compared to Growth
Tax History
| Year | Tax Paid | Tax Assessment Tax Assessment Total Assessment is a certain percentage of the fair market value that is determined by local assessors to be the total taxable value of land and additions on the property. | Land | Improvement |
|---|---|---|---|---|
| 2025 | $4,987 | $401,816 | $303,111 | $98,705 |
| 2024 | $4,987 | $393,938 | $297,168 | $96,770 |
| 2023 | $4,893 | $386,214 | $291,341 | $94,873 |
| 2022 | $4,787 | $378,642 | $285,629 | $93,013 |
| 2021 | $4,735 | $371,218 | $280,028 | $91,190 |
| 2020 | $4,672 | $367,412 | $277,157 | $90,255 |
| 2019 | $4,582 | $360,208 | $271,722 | $88,486 |
| 2018 | $4,490 | $353,146 | $266,395 | $86,751 |
| 2017 | $4,427 | $346,222 | $261,172 | $85,050 |
| 2016 | $4,210 | $339,434 | $256,051 | $83,383 |
| 2015 | $4,150 | $334,336 | $252,205 | $82,131 |
| 2014 | $4,049 | $327,787 | $247,264 | $80,523 |
Source: Public Records
Map
Nearby Homes
- 9200 Westminster Blvd Unit 25
- 9691 Central Ave
- 13262 Verde St
- 10061 15th St
- 13711 Magnolia St
- 13839 Magnolia St
- 9651 Crosby Ave
- 9906 13th St
- 14171 Flower St
- 9141 Jennrich Ave
- 10002 Central Ave Unit 26
- 10002 Central Ave Unit 27
- 10002 Central Ave
- 10002 Central Ave Unit 25
- 13392 Magnolia St
- 9931 Central Ave
- 14362 Bushard St Unit 39
- 14362 Bushard St Unit 109
- 9884 11th St
- 13100 Gilbert St Unit 28
- 9572 Blake Ave
- 13791 Erin St
- 9612 Blake Ave
- 9562 Blake Ave
- 9571 Mansor Ave
- 9611 Mansor Ave
- 13741 Erin St
- 9561 Mansor Ave
- 9571 Blake Ave
- 9622 Blake Ave
- 9542 Blake Ave
- 13742 Erin St
- 9561 Blake Ave
- 9621 Mansor Ave
- 9541 Mansor Ave
- 9621 Blake Ave
- 9632 Blake Ave
- 9541 Blake Ave
- 9532 Blake Ave
- 9631 Mansor Ave