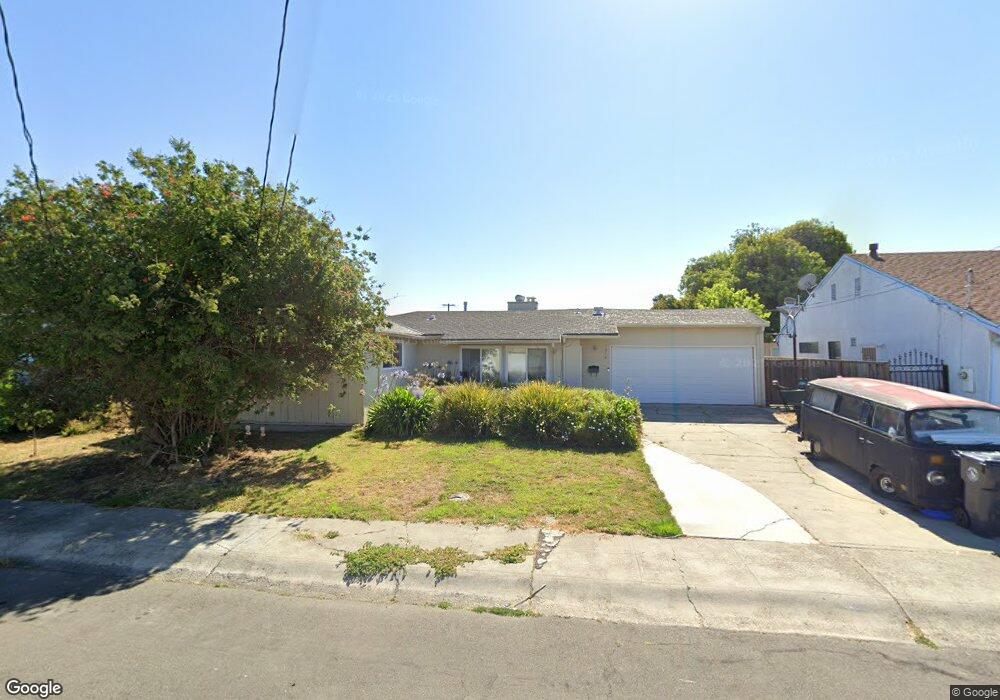
1378 Esser Ave San Leandro, CA 94579
Washington Manor-Bonaire NeighborhoodEstimated Value: $746,000 - $785,000
3
Beds
1
Bath
1,081
Sq Ft
$711/Sq Ft
Est. Value
About This Home
This home is located at 1378 Esser Ave, San Leandro, CA 94579 and is currently estimated at $768,915, approximately $711 per square foot. 1378 Esser Ave is a home located in Alameda County with nearby schools including Dayton Elementary School, Washington Manor Middle School, and Arroyo High School.
Ownership History
Date
Name
Owned For
Owner Type
Purchase Details
Closed on
Sep 13, 2017
Sold by
Feng Wen Z and Guan Wan C
Bought by
Chang Feng Wen Zhao and Chang Guan Wan
Current Estimated Value
Purchase Details
Closed on
Nov 13, 2014
Sold by
Livin Howell Vin and Livin Maureen Howell Revocable
Bought by
Guan Wan C and Feng Wen Z
Home Financials for this Owner
Home Financials are based on the most recent Mortgage that was taken out on this home.
Original Mortgage
$278,600
Outstanding Balance
$95,480
Interest Rate
4.16%
Mortgage Type
New Conventional
Estimated Equity
$673,435
Purchase Details
Closed on
Jan 29, 2013
Sold by
Howell Maureen
Bought by
Maureen Howell Revocable Living Trust
Purchase Details
Closed on
Mar 5, 2012
Sold by
Callahan Dennis and Residual Trust Under The James
Bought by
Howell Maureen
Purchase Details
Closed on
Jun 12, 1995
Sold by
Buckingham Gina Rose Fodrini
Bought by
Wheeler Virginia Marie Fodrini
Create a Home Valuation Report for This Property
The Home Valuation Report is an in-depth analysis detailing your home's value as well as a comparison with similar homes in the area
Home Values in the Area
Average Home Value in this Area
Purchase History
| Date | Buyer | Sale Price | Title Company |
|---|---|---|---|
| Chang Feng Wen Zhao | -- | None Available | |
| Guan Wan C | $398,000 | Placer Title Company | |
| Maureen Howell Revocable Living Trust | -- | None Available | |
| Howell Maureen | -- | None Available | |
| Wheeler Virginia Marie Fodrini | -- | -- |
Source: Public Records
Mortgage History
| Date | Status | Borrower | Loan Amount |
|---|---|---|---|
| Open | Guan Wan C | $278,600 |
Source: Public Records
Tax History Compared to Growth
Tax History
| Year | Tax Paid | Tax Assessment Tax Assessment Total Assessment is a certain percentage of the fair market value that is determined by local assessors to be the total taxable value of land and additions on the property. | Land | Improvement |
|---|---|---|---|---|
| 2025 | $6,191 | $478,319 | $180,271 | $298,048 |
| 2024 | $6,191 | $468,943 | $176,737 | $292,206 |
| 2023 | $6,166 | $459,749 | $173,272 | $286,477 |
| 2022 | $6,073 | $450,735 | $169,875 | $280,860 |
| 2021 | $5,905 | $441,899 | $166,545 | $275,354 |
| 2020 | $5,775 | $437,370 | $164,838 | $272,532 |
| 2019 | $5,783 | $428,797 | $161,607 | $267,190 |
| 2018 | $5,452 | $420,391 | $158,439 | $261,952 |
| 2017 | $5,201 | $412,148 | $155,332 | $256,816 |
| 2016 | $5,078 | $404,069 | $152,287 | $251,782 |
| 2015 | $4,967 | $398,000 | $150,000 | $248,000 |
| 2014 | $1,139 | $59,002 | $35,401 | $23,601 |
Source: Public Records
Map
Nearby Homes
- 14835 Farnsworth St
- 1315 Mersey Ave
- 14820 Crosby St
- 14997 Edgemoor St
- 1063 Bodmin Ave
- 14466 Acacia St
- 15102 Chapel Ct
- 1875 Willow Ave
- 793 Moraga Dr
- 774 Hamlin Way
- 15067 Churchill St
- 3847 Yorkshire St Unit 8
- 3672 Del Monte Way
- 688 Garside Ct
- 1803 Cedar Ave
- 3411 Del Monte Way
- 365 Caliente Cir
- 15149 Norton St
- 391 Anza Way
- 15009 Kesterson St
- 1386 Esser Ave
- 1362 Esser Ave
- 1281 Oberlin Ave
- 1346 Esser Ave
- 1285 Oberlin Ave
- 1277 Oberlin Ave
- 1394 Esser Ave
- 1379 Esser Ave
- 1387 Esser Ave
- 1371 Esser Ave
- 1289 Oberlin Ave
- 1338 Esser Ave
- 1395 Esser Ave
- 1363 Esser Ave
- 1273 Oberlin Ave
- 1287 Purdue St
- 1355 Esser Ave
- 1277 Purdue St
- 1347 Esser Ave
- 1303 Purdue St