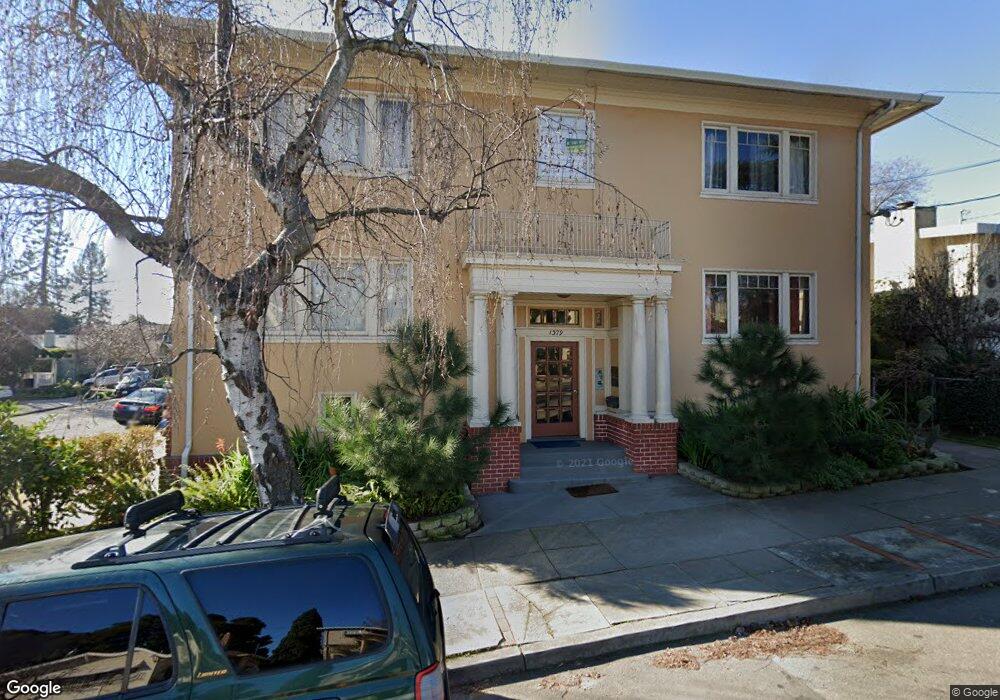
1379 Hampel St Oakland, CA 94602
Glenview NeighborhoodEstimated Value: $387,941 - $627,000
1
Bed
1
Bath
710
Sq Ft
$728/Sq Ft
Est. Value
About This Home
This home is located at 1379 Hampel St, Oakland, CA 94602 and is currently estimated at $516,735, approximately $727 per square foot. 1379 Hampel St is a home located in Alameda County with nearby schools including Glenview Elementary School, Edna Brewer Middle School, and Oakland High School.
Ownership History
Date
Name
Owned For
Owner Type
Purchase Details
Closed on
May 6, 2020
Sold by
Ram Shree Jennifer
Bought by
Ram Shree Jennifer
Current Estimated Value
Home Financials for this Owner
Home Financials are based on the most recent Mortgage that was taken out on this home.
Original Mortgage
$193,000
Outstanding Balance
$171,025
Interest Rate
3.3%
Mortgage Type
New Conventional
Estimated Equity
$345,710
Purchase Details
Closed on
Jun 17, 2017
Sold by
Ram Shree J
Bought by
Ram Shree Jennifer
Purchase Details
Closed on
Jan 7, 2011
Sold by
Dannenberg Thomas A and Guiney Neil T
Bought by
Ram Shree J
Home Financials for this Owner
Home Financials are based on the most recent Mortgage that was taken out on this home.
Original Mortgage
$199,200
Interest Rate
4.82%
Mortgage Type
New Conventional
Create a Home Valuation Report for This Property
The Home Valuation Report is an in-depth analysis detailing your home's value as well as a comparison with similar homes in the area
Home Values in the Area
Average Home Value in this Area
Purchase History
| Date | Buyer | Sale Price | Title Company |
|---|---|---|---|
| Ram Shree Jennifer | -- | Fidelity National Title Co | |
| Ram Shree Jennifer | -- | Fidelity National Title Co | |
| Ram Shree Jennifer | -- | None Available | |
| Ram Shree J | $249,000 | Old Republic Title Company |
Source: Public Records
Mortgage History
| Date | Status | Borrower | Loan Amount |
|---|---|---|---|
| Open | Ram Shree Jennifer | $193,000 | |
| Closed | Ram Shree J | $199,200 |
Source: Public Records
Tax History Compared to Growth
Tax History
| Year | Tax Paid | Tax Assessment Tax Assessment Total Assessment is a certain percentage of the fair market value that is determined by local assessors to be the total taxable value of land and additions on the property. | Land | Improvement |
|---|---|---|---|---|
| 2025 | $5,649 | $311,993 | $95,698 | $223,295 |
| 2024 | $5,649 | $305,741 | $93,822 | $218,919 |
| 2023 | $5,856 | $306,610 | $91,983 | $214,627 |
| 2022 | $5,658 | $293,600 | $90,180 | $210,420 |
| 2021 | $5,317 | $287,705 | $88,411 | $206,294 |
| 2020 | $5,256 | $291,685 | $87,505 | $204,180 |
| 2019 | $4,999 | $285,968 | $85,790 | $200,178 |
| 2018 | $4,896 | $280,363 | $84,109 | $196,254 |
| 2017 | $4,685 | $274,868 | $82,460 | $192,408 |
| 2016 | $4,473 | $269,480 | $80,844 | $188,636 |
| 2015 | $4,446 | $265,433 | $79,630 | $185,803 |
| 2014 | $4,434 | $260,234 | $78,070 | $182,164 |
Source: Public Records
Map
Nearby Homes
- 3945 Randolph Ave Unit 2
- 1235 Hampel St
- 1233 Hampel St
- 1515 Hampel St
- 1621 E 38th St
- 1107 Wellington St
- 3937 Greenwood Ave
- 4426 Park Blvd
- 1415 Trestle Glen Rd
- 1200 El Centro Ave
- 1059 El Centro Ave Unit 3
- 1006 Glendora Ave
- 1703 Macarthur Blvd
- 1701 Macarthur Blvd
- 3541 Dimond Ave
- 3622 Emerson St
- 953 Grosvenor Place
- 1379 Hampel St Unit 4
- 1379 Hampel St Unit 3
- 1379 Hampel St Unit 2
- 1379 Hampel St
- 1379 Hampel St
- 1379 Hampel St
- 4037 Ardley Ave
- 4031 Ardley Ave
- 4100 Randolph Ave
- 1415 Hampel St
- 1359 Hampel St
- 4027 Ardley Ave
- 4116 Randolph Ave
- 1421 Hampel St
- 1406 Hampel St
- 4024 Randolph Ave
- 4023 Ardley Ave
- 1412 Hampel St
- 4018 Randolph Ave
- 4028 Ardley Ave