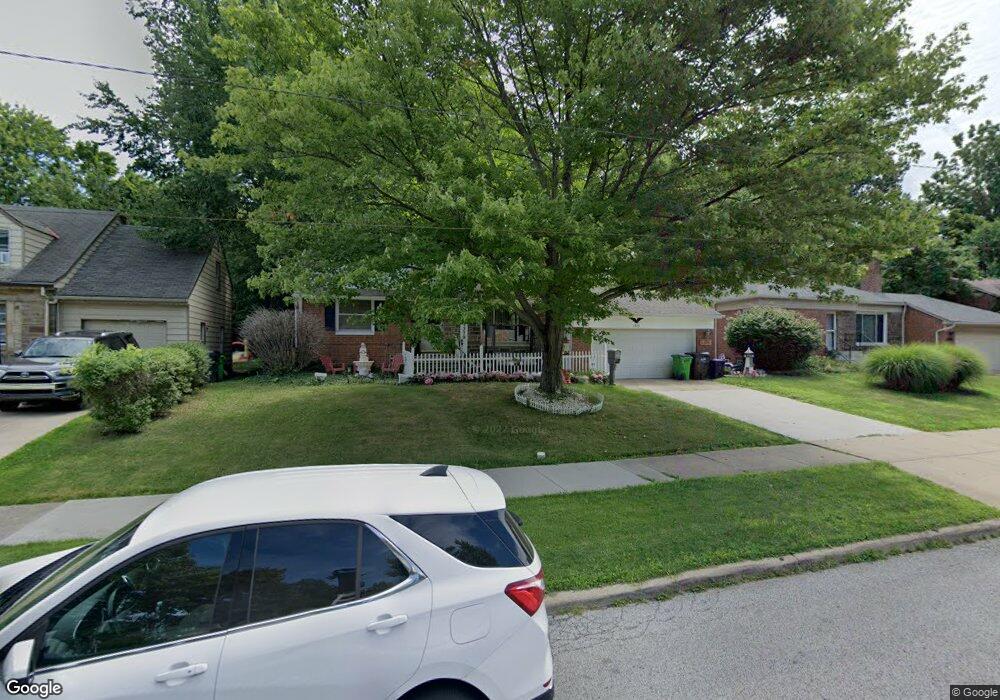
1379 S Belvoir Blvd Cleveland, OH 44121
Estimated Value: $159,436 - $187,000
3
Beds
2
Baths
988
Sq Ft
$175/Sq Ft
Est. Value
About This Home
This home is located at 1379 S Belvoir Blvd, Cleveland, OH 44121 and is currently estimated at $173,359, approximately $175 per square foot. 1379 S Belvoir Blvd is a home located in Cuyahoga County with nearby schools including Rowland Elementary School, Greenview Upper Elementary School, and Memorial Junior High School.
Ownership History
Date
Name
Owned For
Owner Type
Purchase Details
Closed on
Oct 26, 2006
Sold by
Uline John S and Uline Joann F
Bought by
Rivera Thelma
Current Estimated Value
Home Financials for this Owner
Home Financials are based on the most recent Mortgage that was taken out on this home.
Original Mortgage
$117,500
Outstanding Balance
$70,436
Interest Rate
6.45%
Mortgage Type
Purchase Money Mortgage
Estimated Equity
$102,923
Purchase Details
Closed on
Sep 23, 2000
Sold by
Uline Joann F
Bought by
Uline John S
Purchase Details
Closed on
May 21, 1993
Sold by
Duda Florence A
Bought by
Uline John S
Purchase Details
Closed on
Jun 29, 1987
Sold by
James P Duda
Bought by
Duda Florence A
Purchase Details
Closed on
Nov 19, 1979
Sold by
Duda Jas P and F A
Bought by
James P Duda
Purchase Details
Closed on
Jan 1, 1975
Bought by
Duda Jas P and F A
Create a Home Valuation Report for This Property
The Home Valuation Report is an in-depth analysis detailing your home's value as well as a comparison with similar homes in the area
Home Values in the Area
Average Home Value in this Area
Purchase History
| Date | Buyer | Sale Price | Title Company |
|---|---|---|---|
| Rivera Thelma | $117,500 | Guardian Title & Guaranty | |
| Uline John S | -- | -- | |
| Uline John S | $77,500 | -- | |
| Duda Florence A | -- | -- | |
| James P Duda | -- | -- | |
| Duda Jas P | -- | -- |
Source: Public Records
Mortgage History
| Date | Status | Borrower | Loan Amount |
|---|---|---|---|
| Open | Rivera Thelma | $117,500 |
Source: Public Records
Tax History Compared to Growth
Tax History
| Year | Tax Paid | Tax Assessment Tax Assessment Total Assessment is a certain percentage of the fair market value that is determined by local assessors to be the total taxable value of land and additions on the property. | Land | Improvement |
|---|---|---|---|---|
| 2024 | $3,819 | $48,055 | $8,925 | $39,130 |
| 2023 | $3,621 | $36,890 | $7,560 | $29,330 |
| 2022 | $3,602 | $36,890 | $7,560 | $29,330 |
| 2021 | $3,576 | $36,890 | $7,560 | $29,330 |
| 2020 | $3,530 | $31,780 | $6,510 | $25,270 |
| 2019 | $3,233 | $90,800 | $18,600 | $72,200 |
| 2018 | $3,317 | $31,780 | $6,510 | $25,270 |
| 2017 | $3,519 | $32,140 | $6,060 | $26,080 |
| 2016 | $3,497 | $32,140 | $6,060 | $26,080 |
| 2015 | $3,556 | $32,140 | $6,060 | $26,080 |
| 2014 | $3,556 | $33,810 | $6,370 | $27,440 |
Source: Public Records
Map
Nearby Homes
- 0 S Belvoir Blvd Unit 5096678
- 1400 Francis Ct
- 1391 Avondale Rd
- 1400 Avondale Rd
- 1540 S Belvoir Blvd
- 4410 Ardmore Rd
- 1419 Victory Dr
- 1216 Homestead Rd
- 1268 Avondale Rd
- 1539 Sheffield Rd
- 1271 Winston Rd
- 1528 Felton Rd
- 1319 Plainfield Rd
- 1332 S Green Rd
- 1514 Garden Dr
- 1605 Laclede Rd
- 1606 Laclede Rd
- 1356 Plainfield Rd
- 1231 Winston Rd
- 1292 Plainfield Rd
- 1385 S Belvoir Blvd
- 1371 S Belvoir Blvd
- 1365 S Belvoir Blvd
- 1382 Belvoir Mews
- 1380 Belvoir Mews
- 1384 Belvoir Mews
- 1391 S Belvoir Blvd
- 1376 Belvoir Mews
- 1388 Belvoir Mews
- 1388 Belvoir Mews Unit BLVD
- 1361 S Belvoir Blvd
- 1370 Belvoir Mews
- 1390 Belvoir Mews
- 1392 Belvoir Mews
- 1395 S Belvoir Blvd
- 1355 S Belvoir Blvd
- 1364 Belvoir Mews
- 1394 Belvoir Mews
- 1378 S Belvoir Blvd
- 1376 S Belvoir Blvd