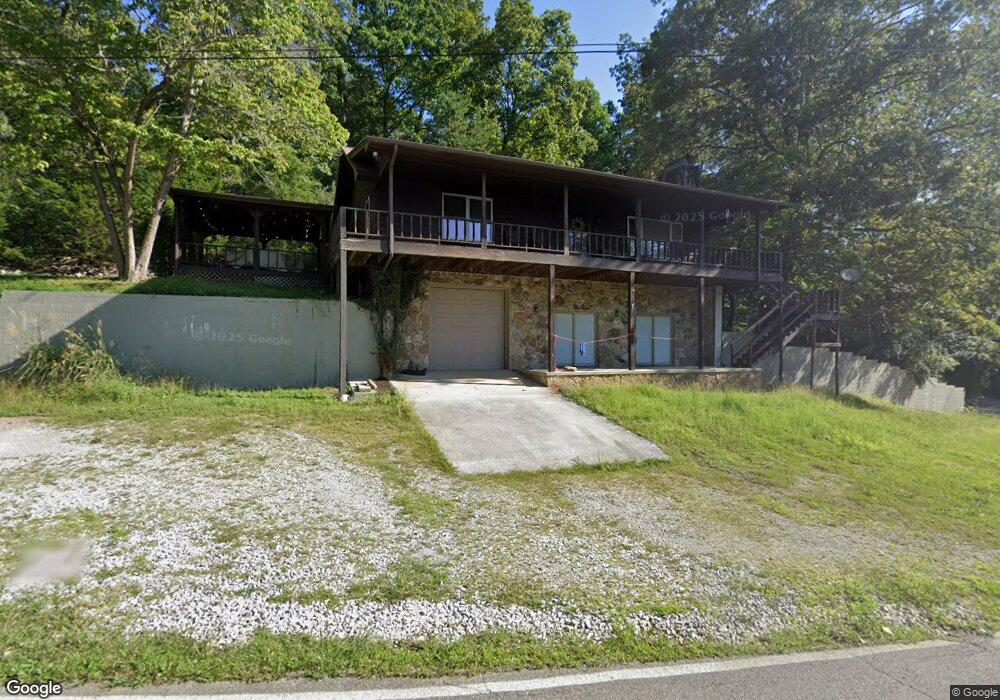
1379 Springs Dock Rd La Follette, TN 37766
Estimated Value: $422,000 - $740,000
--
Bed
--
Bath
2,220
Sq Ft
$248/Sq Ft
Est. Value
About This Home
This home is located at 1379 Springs Dock Rd, La Follette, TN 37766 and is currently estimated at $550,838, approximately $248 per square foot. 1379 Springs Dock Rd is a home.
Ownership History
Date
Name
Owned For
Owner Type
Purchase Details
Closed on
Mar 29, 2021
Sold by
Sabula David and Sabula Barbara
Bought by
Selembo David J and Selembo Janefle
Current Estimated Value
Home Financials for this Owner
Home Financials are based on the most recent Mortgage that was taken out on this home.
Original Mortgage
$693,405
Outstanding Balance
$623,675
Interest Rate
2.9%
Mortgage Type
New Conventional
Estimated Equity
-$72,837
Purchase Details
Closed on
Jul 26, 2017
Sold by
Cripps Theodore J
Bought by
Cripps Theodore J And Cathy A Cripps Trust
Purchase Details
Closed on
Mar 13, 2012
Sold by
Federal Home Loan Mortgage Corporation
Bought by
Cripps Theodore J
Purchase Details
Closed on
Mar 6, 1998
Sold by
Daniels Eugene
Bought by
Yates Jack
Purchase Details
Closed on
Aug 23, 1990
Bought by
Daniels Eugene and Daniels Sadie
Purchase Details
Closed on
Aug 21, 1984
Bought by
Suttles John D and Suttles Verda
Purchase Details
Closed on
Nov 16, 1982
Create a Home Valuation Report for This Property
The Home Valuation Report is an in-depth analysis detailing your home's value as well as a comparison with similar homes in the area
Home Values in the Area
Average Home Value in this Area
Purchase History
| Date | Buyer | Sale Price | Title Company |
|---|---|---|---|
| Selembo David J | $729,900 | None Available | |
| Cripps Theodore J And Cathy A Cripps Trust | -- | -- | |
| Theodore & Cathy Cripps Trust | -- | None Available | |
| Cripps Theodore J | $135,000 | -- | |
| Yates Jack | $117,000 | -- | |
| Daniels Eugene | $78,000 | -- | |
| Suttles John D | -- | -- | |
| -- | -- | -- |
Source: Public Records
Mortgage History
| Date | Status | Borrower | Loan Amount |
|---|---|---|---|
| Open | Selembo David J | $693,405 |
Source: Public Records
Tax History Compared to Growth
Tax History
| Year | Tax Paid | Tax Assessment Tax Assessment Total Assessment is a certain percentage of the fair market value that is determined by local assessors to be the total taxable value of land and additions on the property. | Land | Improvement |
|---|---|---|---|---|
| 2025 | $1,060 | $87,200 | $0 | $0 |
| 2024 | $1,060 | $87,200 | $15,450 | $71,750 |
| 2023 | $904 | $43,750 | $7,700 | $36,050 |
| 2022 | $904 | $43,750 | $7,700 | $36,050 |
| 2021 | $904 | $43,750 | $7,700 | $36,050 |
| 2020 | $886 | $43,750 | $7,700 | $36,050 |
| 2019 | $904 | $43,750 | $7,700 | $36,050 |
| 2018 | $975 | $43,325 | $7,000 | $36,325 |
| 2017 | $975 | $43,325 | $7,000 | $36,325 |
| 2016 | $975 | $43,325 | $7,000 | $36,325 |
| 2015 | $862 | $43,325 | $7,000 | $36,325 |
| 2014 | $862 | $43,325 | $7,000 | $36,325 |
| 2013 | -- | $43,325 | $7,000 | $36,325 |
Source: Public Records
Map
Nearby Homes
- 309 Alder Shore Ln
- 195 Kennedys Loop
- 0 Lakesprings Dr Unit 1315301
- 150 E Harbor View Ln
- 118 E Harbor View Ln Unit A
- 118 E Harbor View Ln Unit B
- Lot10 Chapman Rd
- Lot 8 Chapman Rd
- Lot 3 Chapman Rd
- Lot 2 Chapman Rd
- Lot 7 Chapman Rd
- Lot 6 Chapman Rd
- Lot 9 Chapman Rd
- Lot 1 Chapman Rd
- Lot 4 Chapman Rd
- Lot 5 Chapman Rd
- 135 N Deer Hill Village Ln Unit A
- 131 N Deer Village Ln Unit B
- 207 N Deer Hill Village Unit A
- 195 N Deer Village Ln Unit B
- 1379 Alder Springs Rd
- 1359 Springs Dock Rd
- 1359 Alder Springs Rd E of Rd
- 1386 Alder Springs Rd
- 1376 Alder Springs Rd
- 1370 Springs Dock Rd
- 1342 Springs Dock Rd
- 1322 Springs Dock Rd
- Lot 53 Alder Springs Rd
- 211 Old Alder Springs Rd
- 1454 Springs Dock Rd
- 1652 Springs Dock Rd
- 206 Cross Rd
- 1575 Alder Springs Rd
- 1304 Alder Springs Rd
- 1571 Alder Springs Rd
- 242 Cross Rd
- 396 Pearl Dr
- 376 Pearl Dr
- 183 Lakiens Way