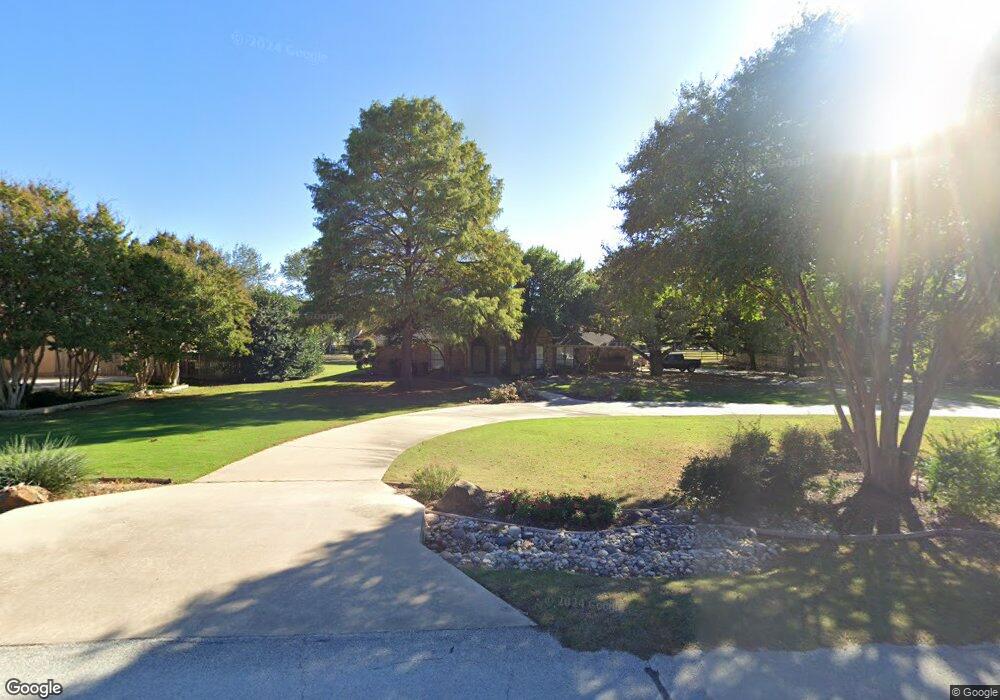
1379 Woodbrook Ln Southlake, TX 76092
Estimated Value: $1,067,915 - $1,297,000
3
Beds
2
Baths
2,852
Sq Ft
$418/Sq Ft
Est. Value
About This Home
This home is located at 1379 Woodbrook Ln, Southlake, TX 76092 and is currently estimated at $1,193,229, approximately $418 per square foot. 1379 Woodbrook Ln is a home located in Tarrant County with nearby schools including Carroll Elementary School, Don T. Durham Intermediate School, and Carroll Middle School.
Ownership History
Date
Name
Owned For
Owner Type
Purchase Details
Closed on
Aug 12, 2002
Sold by
Stewart Kenneth D and Stewart Janie K
Bought by
2002 Stewart Family Trust
Current Estimated Value
Purchase Details
Closed on
Aug 22, 1994
Sold by
Clark Richard Scott
Bought by
Stewart Kenneth D and Stewart Janie K
Home Financials for this Owner
Home Financials are based on the most recent Mortgage that was taken out on this home.
Original Mortgage
$170,000
Interest Rate
8.66%
Purchase Details
Closed on
Jun 1, 1993
Sold by
Revord Lisa Ann and Clark Lisa Ann
Bought by
Clark Richard Scott
Home Financials for this Owner
Home Financials are based on the most recent Mortgage that was taken out on this home.
Original Mortgage
$143,200
Interest Rate
7.16%
Mortgage Type
Seller Take Back
Create a Home Valuation Report for This Property
The Home Valuation Report is an in-depth analysis detailing your home's value as well as a comparison with similar homes in the area
Home Values in the Area
Average Home Value in this Area
Purchase History
| Date | Buyer | Sale Price | Title Company |
|---|---|---|---|
| 2002 Stewart Family Trust | -- | -- | |
| Stewart Kenneth D | -- | American Title Company | |
| Clark Richard Scott | -- | -- |
Source: Public Records
Mortgage History
| Date | Status | Borrower | Loan Amount |
|---|---|---|---|
| Previous Owner | Stewart Kenneth D | $170,000 | |
| Previous Owner | Clark Richard Scott | $143,200 |
Source: Public Records
Tax History Compared to Growth
Tax History
| Year | Tax Paid | Tax Assessment Tax Assessment Total Assessment is a certain percentage of the fair market value that is determined by local assessors to be the total taxable value of land and additions on the property. | Land | Improvement |
|---|---|---|---|---|
| 2025 | $4,218 | $977,201 | $546,000 | $431,201 |
| 2024 | $4,218 | $977,201 | $546,000 | $431,201 |
| 2023 | $12,815 | $954,790 | $546,000 | $408,790 |
| 2022 | $13,790 | $734,807 | $392,500 | $342,307 |
| 2021 | $13,248 | $636,387 | $392,500 | $243,887 |
| 2020 | $12,142 | $556,826 | $464,000 | $92,826 |
| 2019 | $11,629 | $557,569 | $464,000 | $93,569 |
| 2018 | $6,752 | $436,568 | $290,431 | $146,137 |
| 2017 | $9,837 | $481,689 | $264,000 | $217,689 |
| 2016 | $8,943 | $501,727 | $264,500 | $237,227 |
| 2015 | $6,551 | $328,000 | $75,000 | $253,000 |
| 2014 | $6,551 | $328,000 | $75,000 | $253,000 |
Source: Public Records
Map
Nearby Homes
- 1340 Meadow Glen
- 1371 Holland Hill
- 904 Palos Verdes Trail
- 1811 Redwing Ct
- 2009 Montecito Trail
- 550 N Peytonville Ave
- 2116 Camden Cir
- 207 Killdeer Trail
- 203 Donley Ct
- 1807 Mesquite Ct
- 1712 Wild Rose Way
- 1820 Beam Dr
- 2415 Poplar Ct
- 204 Southridge Lakes Pkwy
- 205 Lovegrass Ln
- 2530 & 2580 W Southlake Blvd
- 2304 Top Rail Ln
- 2405 Fernwood Dr
- 810 Brazos Dr
- 16 Marvin St
- 1377 Woodbrook Ln
- 1381 Woodbrook Ln
- 1338 Meadow Glen
- 1376 Woodbrook Ln
- 1357 Ten Bar Trail
- 1336 Meadow Glen
- 1381 Lakeview Dr
- 1383 Woodbrook Ln
- 1374 Woodbrook Ln
- 1342 Meadow Glen
- 1376 Holland Hill
- 1378 Woodbrook Ln
- 1383 Lakeview Dr
- 1335 Meadow Glen
- 1337 Meadow Glen
- 1346 Meadow Glen
- 1375 Lakeview Dr
- 1339 Meadow Glen
- 1375 Holland Hill
- 1385 Lakeview Dr