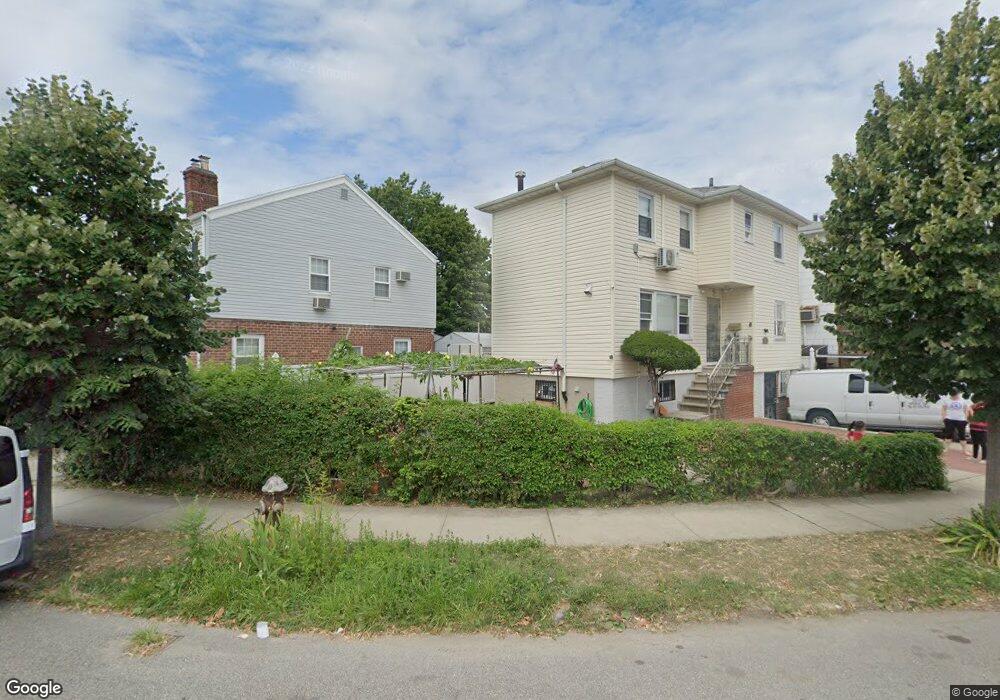
138-53 64th Ave Flushing, NY 11367
Flushing NeighborhoodEstimated Value: $1,076,000 - $1,228,372
--
Bed
3
Baths
2,040
Sq Ft
$549/Sq Ft
Est. Value
About This Home
This home is located at 138-53 64th Ave, Flushing, NY 11367 and is currently estimated at $1,119,843, approximately $548 per square foot. 138-53 64th Ave is a home located in Queens County with nearby schools including I.S. 250 - The Robert F. Kennedy Community Middle School, John Bowne High School, and Yeshiva Of Central Queens.
Ownership History
Date
Name
Owned For
Owner Type
Purchase Details
Closed on
Aug 12, 2016
Sold by
Rana Uma
Bought by
Chen Yongqi and Weng Dan Bin
Current Estimated Value
Create a Home Valuation Report for This Property
The Home Valuation Report is an in-depth analysis detailing your home's value as well as a comparison with similar homes in the area
Home Values in the Area
Average Home Value in this Area
Purchase History
| Date | Buyer | Sale Price | Title Company |
|---|---|---|---|
| Chen Yongqi | $765,000 | -- |
Source: Public Records
Tax History Compared to Growth
Tax History
| Year | Tax Paid | Tax Assessment Tax Assessment Total Assessment is a certain percentage of the fair market value that is determined by local assessors to be the total taxable value of land and additions on the property. | Land | Improvement |
|---|---|---|---|---|
| 2025 | $8,128 | $42,893 | $6,698 | $36,195 |
| 2024 | $8,128 | $40,466 | $6,901 | $33,565 |
| 2023 | $8,142 | $40,090 | $5,769 | $34,321 |
| 2022 | $7,550 | $61,140 | $10,560 | $50,580 |
| 2021 | $7,960 | $60,780 | $10,560 | $50,220 |
| 2020 | $7,566 | $66,780 | $10,560 | $56,220 |
| 2019 | $7,054 | $58,440 | $10,560 | $47,880 |
| 2018 | $6,810 | $33,408 | $7,452 | $25,956 |
| 2017 | $6,425 | $31,518 | $7,662 | $23,856 |
| 2016 | $2,529 | $31,518 | $7,662 | $23,856 |
| 2015 | $1,354 | $29,787 | $10,677 | $19,110 |
| 2014 | $1,354 | $28,102 | $9,631 | $18,471 |
Source: Public Records
Map
Nearby Homes
- 138-65 63rd Ave
- 63-05 138th St
- 63-09 138th St
- 6431 138th St
- 64-35 138th St
- 61-12 Main St
- 136-28 62nd Ave
- 6339 136th St
- 61-31 136th St
- 13506 62nd Rd
- 148-40 61st Rd
- 148-03 Horace Harding Expy
- 144-60 Gravett Rd Unit 6F
- 144-60 Gravett Rd Unit 1C
- 144-60 Gravett Rd Unit 4J
- 144-55 Melbourne Ave Unit 2F
- 144-55 Melbourne Ave Unit 4A
- 144-55 Melbourne Ave Unit 2E
- 144-55 Melbourne Ave Unit 3J
- 144-55 Melbourne Ave Unit 6E
- 138-53 64 Ave
- 138-59 64th Ave
- 13839 64th Ave
- 13835 64th Ave
- 13841 64th Ave
- 13833 64th Ave
- 138-47 64th Ave
- 13845 64th Ave
- 13829 64th Ave
- 138-27 64th Ave
- 13847 64th Ave
- 13827 64th Ave
- 13823 64th Ave
- 13823 64th Ave
- 13853 64th Ave
- 13846 64th Ave
- 13844 64th Ave
- 138-36 64th Ave
- 13848 64th Ave
- 13821 64th Ave