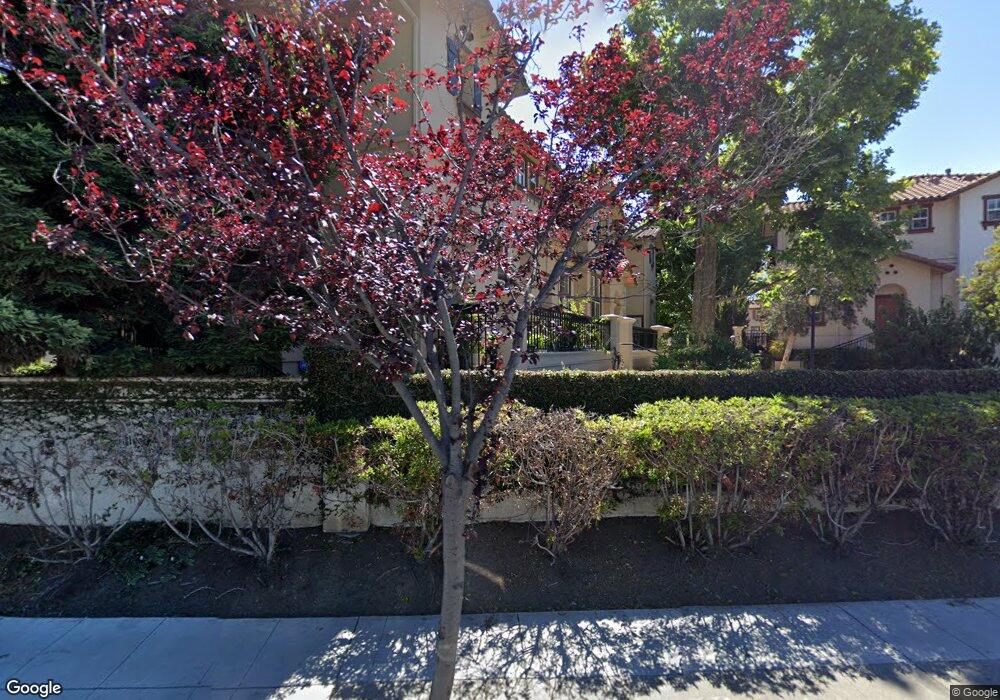
138 Abella Cir San Pablo, CA 94806
Estimated Value: $680,997 - $872,000
4
Beds
3
Baths
2,141
Sq Ft
$367/Sq Ft
Est. Value
About This Home
This home is located at 138 Abella Cir, San Pablo, CA 94806 and is currently estimated at $785,749, approximately $367 per square foot. 138 Abella Cir is a home located in Contra Costa County with nearby schools including Lake Elementary School, Walter T. Helms Middle School, and Richmond High School.
Ownership History
Date
Name
Owned For
Owner Type
Purchase Details
Closed on
Mar 9, 2010
Sold by
Hom Hing
Bought by
Liu Renee
Current Estimated Value
Home Financials for this Owner
Home Financials are based on the most recent Mortgage that was taken out on this home.
Original Mortgage
$217,000
Outstanding Balance
$142,897
Interest Rate
4.93%
Mortgage Type
New Conventional
Estimated Equity
$642,852
Purchase Details
Closed on
Feb 11, 2010
Sold by
Bank Of America National Association
Bought by
Liu Renee
Home Financials for this Owner
Home Financials are based on the most recent Mortgage that was taken out on this home.
Original Mortgage
$217,000
Outstanding Balance
$142,897
Interest Rate
4.93%
Mortgage Type
New Conventional
Estimated Equity
$642,852
Purchase Details
Closed on
Oct 22, 2009
Sold by
Choy Jerrick John and Choy Joan Chung
Bought by
Lasalle Bank Na
Purchase Details
Closed on
Nov 5, 2003
Sold by
Signature At Abella Llc
Bought by
Choy Jerrick John and Choy Joan Chung
Home Financials for this Owner
Home Financials are based on the most recent Mortgage that was taken out on this home.
Original Mortgage
$353,925
Interest Rate
4.3%
Mortgage Type
Purchase Money Mortgage
Create a Home Valuation Report for This Property
The Home Valuation Report is an in-depth analysis detailing your home's value as well as a comparison with similar homes in the area
Home Values in the Area
Average Home Value in this Area
Purchase History
| Date | Buyer | Sale Price | Title Company |
|---|---|---|---|
| Liu Renee | -- | Service Link | |
| Liu Renee | $317,000 | Service Link | |
| Lasalle Bank Na | $293,250 | Servicelink | |
| Choy Jerrick John | $472,000 | Chicago Title |
Source: Public Records
Mortgage History
| Date | Status | Borrower | Loan Amount |
|---|---|---|---|
| Open | Liu Renee | $217,000 | |
| Previous Owner | Choy Jerrick John | $353,925 |
Source: Public Records
Tax History Compared to Growth
Tax History
| Year | Tax Paid | Tax Assessment Tax Assessment Total Assessment is a certain percentage of the fair market value that is determined by local assessors to be the total taxable value of land and additions on the property. | Land | Improvement |
|---|---|---|---|---|
| 2025 | $6,342 | $409,175 | $106,872 | $302,303 |
| 2024 | $6,204 | $401,153 | $104,777 | $296,376 |
| 2023 | $6,204 | $393,288 | $102,723 | $290,565 |
| 2022 | $6,113 | $385,577 | $100,709 | $284,868 |
| 2021 | $6,079 | $378,018 | $98,735 | $279,283 |
| 2019 | $5,747 | $366,807 | $95,807 | $271,000 |
| 2018 | $5,525 | $359,616 | $93,929 | $265,687 |
| 2017 | $5,388 | $352,566 | $92,088 | $260,478 |
| 2016 | $5,312 | $345,654 | $90,283 | $255,371 |
| 2015 | $5,286 | $340,463 | $88,927 | $251,536 |
| 2014 | $5,234 | $333,795 | $87,186 | $246,609 |
Source: Public Records
Map
Nearby Homes
- 215 Santa Barbara St
- 2571 El Portal Dr Unit D
- 117 Carmel St
- 2585 El Portal Dr Unit C
- 2430 Bancroft Ln
- 2732 Clarendon Ct
- 14433 San Pablo Ave
- 2885 Willow Rd Unit 17
- 2810 Devon Way
- 2919 Willow Rd
- 1976 Van Ness St
- 2489 20th St
- 13700 San Pablo Ave Unit 1315
- 13700 San Pablo Ave Unit 2204
- 13700 San Pablo Ave Unit 1210
- 13700 San Pablo Ave Unit 1107
- 13700 San Pablo Ave Unit 2115
- 13700 San Pablo Ave Unit 2207
- 13700 San Pablo Ave Unit 1318
- 2921 Rollingwood Dr
- 136 Abella Cir
- 110 Dolores Ct
- 108 Dolores Ct
- 134 Abella Cir
- 182 San Fernando St
- 173 San Antonio St
- 106 Dolores Ct
- 184 San Fernando St
- 163 San Luis Obispo St
- 161 San Luis Obispo St
- 159 San Luis Obispo St
- 165 San Luis Obispo St
- 186 San Fernando St
- 157 San Luis Obispo St
- 102 Dolores Ct
- 167 San Luis Obispo St
- 175 San Antonio St
- 104 Dolores Ct
- 132 Abella Cir
- 188 San Fernando St