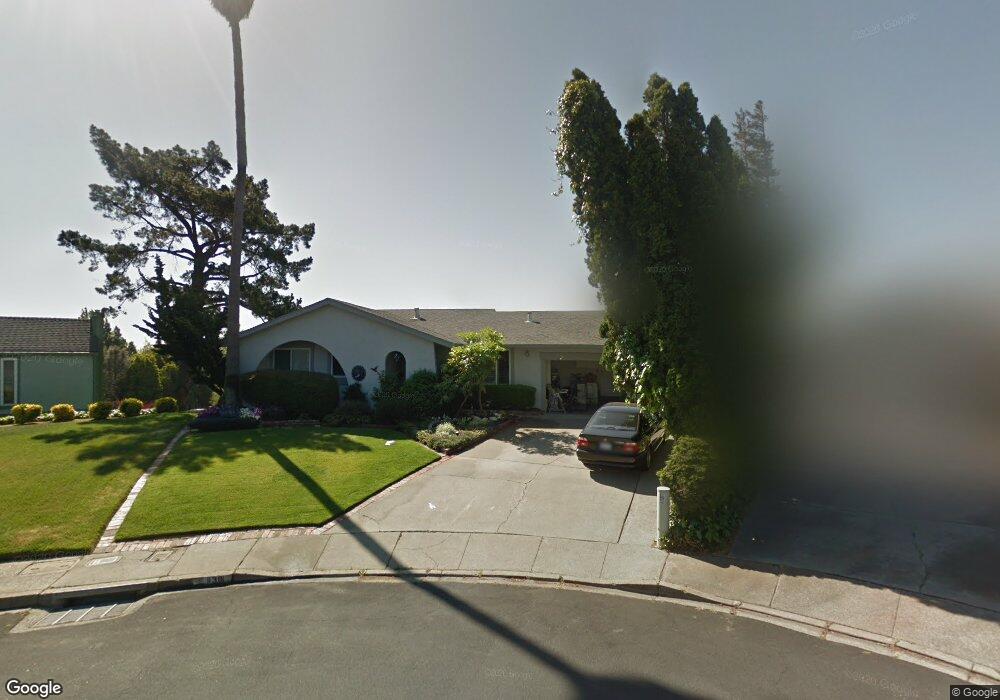
138 Ardmore Way Benicia, CA 94510
Estimated Value: $787,000 - $830,000
3
Beds
2
Baths
1,762
Sq Ft
$460/Sq Ft
Est. Value
About This Home
This home is located at 138 Ardmore Way, Benicia, CA 94510 and is currently estimated at $810,546, approximately $460 per square foot. 138 Ardmore Way is a home located in Solano County with nearby schools including Mary Farmar Elementary School, Benicia Middle School, and Benicia High School.
Ownership History
Date
Name
Owned For
Owner Type
Purchase Details
Closed on
Sep 20, 2019
Sold by
Kelly Sherry M
Bought by
Kelly Sherry M and Sherry M Kelly Family Trust
Current Estimated Value
Home Financials for this Owner
Home Financials are based on the most recent Mortgage that was taken out on this home.
Original Mortgage
$343,639
Outstanding Balance
$301,001
Interest Rate
3.6%
Estimated Equity
$509,545
Purchase Details
Closed on
Apr 27, 2015
Sold by
Kelly Sherry M
Bought by
Kelly Sherry M
Purchase Details
Closed on
May 4, 2007
Sold by
Kelly Roger P and Kelly Sherry M
Bought by
Kelly Roger P and Kelly Sherry M
Home Financials for this Owner
Home Financials are based on the most recent Mortgage that was taken out on this home.
Original Mortgage
$417,000
Interest Rate
6.14%
Mortgage Type
New Conventional
Purchase Details
Closed on
Jun 27, 2005
Sold by
Kelly Roger P and Kelly Sherry M
Bought by
Kelly Roger P and Kelly Sherry M
Create a Home Valuation Report for This Property
The Home Valuation Report is an in-depth analysis detailing your home's value as well as a comparison with similar homes in the area
Home Values in the Area
Average Home Value in this Area
Purchase History
| Date | Buyer | Sale Price | Title Company |
|---|---|---|---|
| Kelly Sherry M | -- | Servicelink | |
| Kelly Sherry M | -- | Servicelink | |
| Kelly Sherry M | -- | None Available | |
| Kelly Roger P | -- | North American Title Co | |
| Kelly Roger P | -- | North American Title Co | |
| Kelly Roger P | -- | -- |
Source: Public Records
Mortgage History
| Date | Status | Borrower | Loan Amount |
|---|---|---|---|
| Open | Kelly Sherry M | $343,639 | |
| Previous Owner | Kelly Roger P | $417,000 |
Source: Public Records
Tax History Compared to Growth
Tax History
| Year | Tax Paid | Tax Assessment Tax Assessment Total Assessment is a certain percentage of the fair market value that is determined by local assessors to be the total taxable value of land and additions on the property. | Land | Improvement |
|---|---|---|---|---|
| 2025 | $4,847 | $420,257 | $90,182 | $330,075 |
| 2024 | $4,847 | $412,017 | $88,414 | $323,603 |
| 2023 | $4,729 | $403,939 | $86,681 | $317,258 |
| 2022 | $4,639 | $396,020 | $84,982 | $311,038 |
| 2021 | $4,543 | $388,256 | $83,316 | $304,940 |
| 2020 | $4,482 | $384,276 | $82,462 | $301,814 |
| 2019 | $4,403 | $376,743 | $80,846 | $295,897 |
| 2018 | $4,289 | $369,357 | $79,261 | $290,096 |
| 2017 | $4,188 | $362,115 | $77,707 | $284,408 |
| 2016 | $4,219 | $355,016 | $76,184 | $278,832 |
| 2015 | $4,111 | $349,684 | $75,040 | $274,644 |
| 2014 | -- | $342,836 | $73,571 | $269,265 |
Source: Public Records
Map
Nearby Homes
- 2016 Clearview Cir
- 117 Sunset Cir Unit 37
- 117 Sunset Cir Unit 36
- 117 Sunset Cir Unit 34
- 112 Inverness Ct
- 102 Banbury Way
- 132 Chelsea Hills Dr
- 1893 Shirley Dr
- 543 Sandy Way
- 1843 Shirley Dr
- 1844 Shirley Dr
- 119 Mountview Terrace
- 253 Carlisle Way
- 500 Raymond Dr
- 263 Carlisle Way
- 2135 E 2nd St
- 47 Alta Loma
- 212 Panorama Dr
- 15 Buena Vista
- 101 Panorama Dr
- 136 Ardmore Way
- 140 Ardmore Way
- 134 Ardmore Way
- 142 Ardmore Way
- 144 Ardmore Way
- 132 Ardmore Way
- 2257 Clearview Cir
- 2259 Clearview Cir
- 2255 Clearview Cir
- 2253 Clearview Cir
- 2251 Clearview Cir
- 2249 Clearview Cir
- 146 Ardmore Way
- 130 Ardmore Way
- 131 Ardmore Way
- 2254 Havenhill Dr
- 2268 Havenhill Dr
- 2240 Havenhill Dr
- 133 Ardmore Way
- 2306 Havenhill Dr