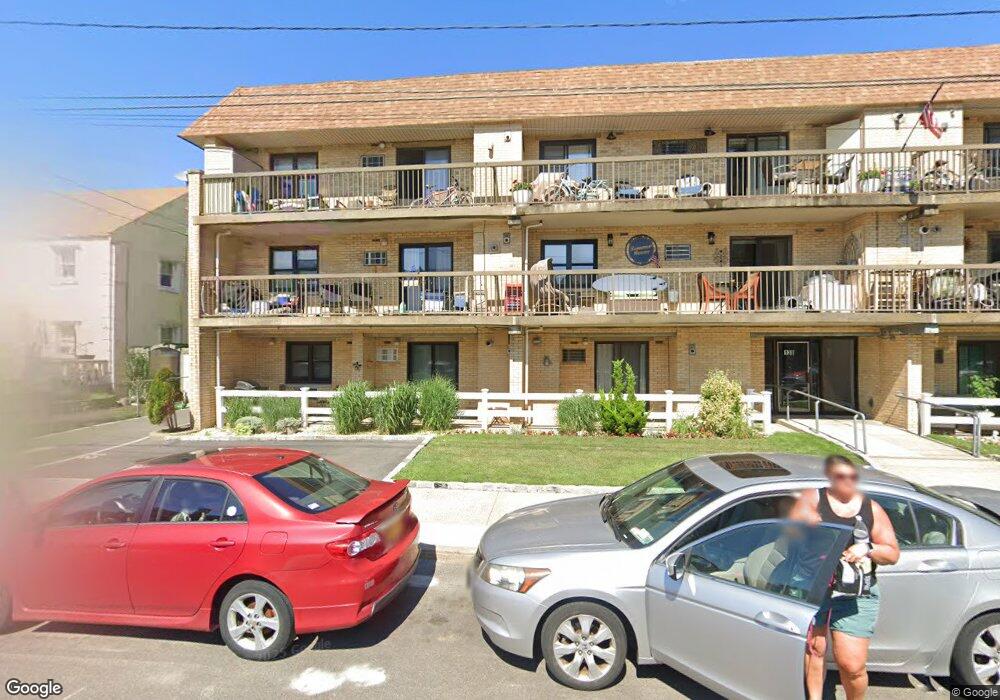
138 Beach 125th St Unit 1H Rockaway Park, NY 11694
Belle Harbor NeighborhoodEstimated Value: $305,000 - $751,000
--
Bed
--
Bath
579
Sq Ft
$780/Sq Ft
Est. Value
About This Home
This home is located at 138 Beach 125th St Unit 1H, Rockaway Park, NY 11694 and is currently estimated at $451,384, approximately $779 per square foot. 138 Beach 125th St Unit 1H is a home located in Queens County with nearby schools including P.S./M.S. 114 The Belle Harbor School, St. Francis De Sales School, and Yeshiva Of Belle Harbor.
Ownership History
Date
Name
Owned For
Owner Type
Purchase Details
Closed on
Apr 22, 2002
Sold by
Federal Nat'L Mtge Assoc
Bought by
O'Sullivan Christopher
Current Estimated Value
Home Financials for this Owner
Home Financials are based on the most recent Mortgage that was taken out on this home.
Original Mortgage
$100,000
Outstanding Balance
$42,016
Interest Rate
7%
Mortgage Type
Purchase Money Mortgage
Estimated Equity
$409,368
Purchase Details
Closed on
Jan 11, 2002
Sold by
Mattone Irene and Wurmbrand Michael P
Bought by
Federal National Mortgag
Purchase Details
Closed on
Aug 30, 2000
Sold by
Wurmbrand Michael P
Bought by
Wurmbrand Michael P and Wurmbrand Rosalie
Home Financials for this Owner
Home Financials are based on the most recent Mortgage that was taken out on this home.
Original Mortgage
$114,000
Interest Rate
7.81%
Mortgage Type
Purchase Money Mortgage
Create a Home Valuation Report for This Property
The Home Valuation Report is an in-depth analysis detailing your home's value as well as a comparison with similar homes in the area
Home Values in the Area
Average Home Value in this Area
Purchase History
| Date | Buyer | Sale Price | Title Company |
|---|---|---|---|
| O'Sullivan Christopher | -- | -- | |
| O'Sullivan Christopher | -- | -- | |
| Federal National Mortgag | -- | -- | |
| Federal National Mortgag | -- | -- | |
| Wurmbrand Michael P | -- | -- | |
| Wurmbrand Michael P | -- | -- |
Source: Public Records
Mortgage History
| Date | Status | Borrower | Loan Amount |
|---|---|---|---|
| Open | O'Sullivan Christopher | $100,000 | |
| Closed | O'Sullivan Christopher | $100,000 | |
| Previous Owner | Wurmbrand Michael P | $114,000 |
Source: Public Records
Tax History Compared to Growth
Tax History
| Year | Tax Paid | Tax Assessment Tax Assessment Total Assessment is a certain percentage of the fair market value that is determined by local assessors to be the total taxable value of land and additions on the property. | Land | Improvement |
|---|---|---|---|---|
| 2025 | $2,895 | $14,525 | $429 | $14,096 |
| 2024 | $2,895 | $14,416 | $494 | $13,922 |
| 2023 | $2,732 | $13,600 | $513 | $13,087 |
| 2022 | $2,371 | $16,920 | $684 | $16,236 |
| 2021 | $2,547 | $12,104 | $684 | $11,420 |
| 2020 | $2,588 | $13,227 | $684 | $12,543 |
| 2019 | $2,538 | $13,920 | $684 | $13,236 |
| 2018 | $2,334 | $11,448 | $586 | $10,862 |
| 2017 | $1,902 | $10,800 | $565 | $10,235 |
| 2016 | $1,727 | $10,800 | $565 | $10,235 |
| 2015 | $1,009 | $10,189 | $674 | $9,515 |
| 2014 | $1,009 | $10,112 | $673 | $9,439 |
Source: Public Records
Map
Nearby Homes
- 138 Beach 125th St Unit 3C
- 125 Beach 124th St Unit 6H
- 125 Beach 124th St Unit 2L
- 123-10 Ocean Promenade Unit 7 N
- 123-10 Ocean Promenade Unit 5M
- 121-16 Ocean Promenade Unit 4L
- 1-63 Beach 128th St Unit 3A
- 1-90 Beach 122nd St
- 144 Beach 121st St Unit 4A
- 144 Beach 121st St Unit 2A
- 144 Beach 121st St Unit 1A
- 182 Beach 129th St
- 1-33 Beach 120th St Unit 2C
- 133 Beach 120th St Unit 1E
- 161 Beach 129th St
- 118-20 Ocean Promenade Unit 6D
- 118-20 Ocean Promenade Unit 5D
- 130 Beach 119th St Unit 3B
- 2-49 Beach 128th St
- 253 Beach 128th St
- 138 Beach 125th St Unit 3H
- 138 Beach 125th St Unit 3G
- 138 Beach 125th St Unit 3F
- 138 Beach 125th St Unit 3E
- 138 Beach 125th St Unit 3D
- 138 Beach 125th St Unit 3B
- 138 Beach 125th St Unit 3A
- 138 Beach 125th St Unit 2H
- 138 Beach 125th St Unit 2G
- 138 Beach 125th St Unit 2F
- 138 Beach 125th St Unit 2D
- 138 Beach 125th St Unit 2C
- 138 Beach 125th St Unit 2B
- 138 Beach 125th St Unit 2A
- 138 Beach 125th St Unit 1G
- 138 Beach 125th St Unit 1F
- 138 Beach 125th St Unit 1E
- 138 Beach 125th St Unit 1D
- 138 Beach 125th St Unit 1C
- 138 Beach 125th St Unit 1B