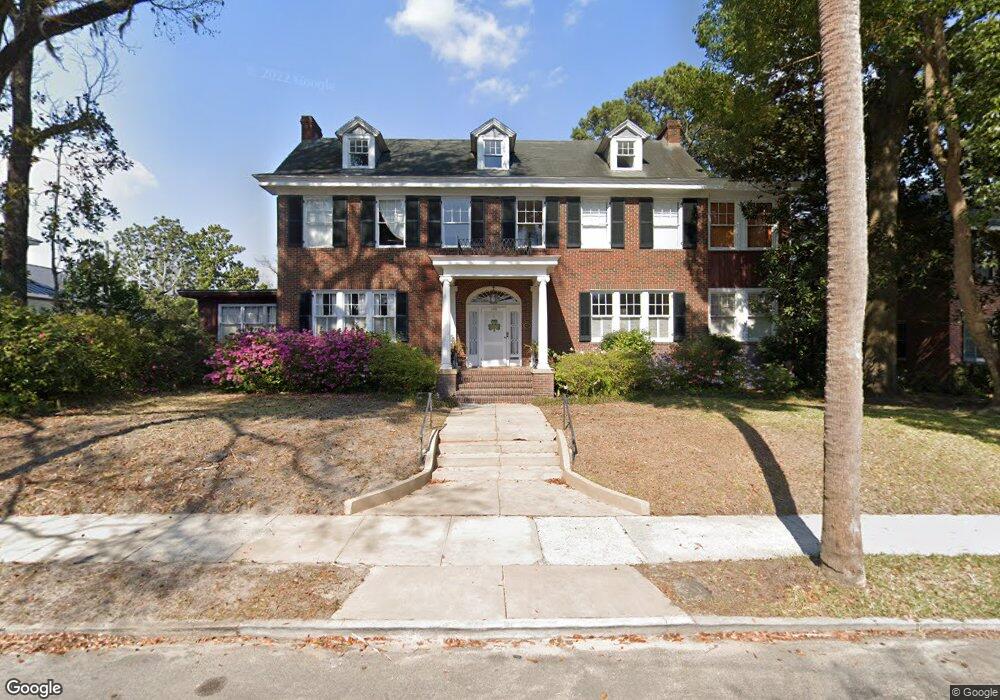
138 E 51st St Savannah, GA 31405
Ardsley Park-Chatham Crescent NeighborhoodEstimated Value: $1,026,780 - $1,196,000
4
Beds
4
Baths
3,862
Sq Ft
$287/Sq Ft
Est. Value
About This Home
This home is located at 138 E 51st St, Savannah, GA 31405 and is currently estimated at $1,106,695, approximately $286 per square foot. 138 E 51st St is a home located in Chatham County with nearby schools including Jacob G. Smith Elementary School, Myers Middle School, and Beach High School.
Ownership History
Date
Name
Owned For
Owner Type
Purchase Details
Closed on
Nov 4, 2011
Sold by
Federal National Mortgage Association
Bought by
Milling Elizabeth F
Current Estimated Value
Purchase Details
Closed on
Aug 2, 2011
Sold by
Not Provided
Bought by
Federal National Mtg Associati
Create a Home Valuation Report for This Property
The Home Valuation Report is an in-depth analysis detailing your home's value as well as a comparison with similar homes in the area
Home Values in the Area
Average Home Value in this Area
Purchase History
| Date | Buyer | Sale Price | Title Company |
|---|---|---|---|
| Milling Elizabeth F | $345,000 | -- | |
| Milling Elizabeth F | $345,000 | -- | |
| Federal National Mtg Associati | $320,000 | -- | |
| Federal National Mtg Associati | $320,000 | -- |
Source: Public Records
Tax History
| Year | Tax Paid | Tax Assessment Tax Assessment Total Assessment is a certain percentage of the fair market value that is determined by local assessors to be the total taxable value of land and additions on the property. | Land | Improvement |
|---|---|---|---|---|
| 2025 | $5,914 | $323,560 | $64,000 | $259,560 |
| 2024 | $52 | $300,800 | $52,000 | $248,800 |
| 2023 | $2,499 | $266,480 | $64,800 | $201,680 |
| 2022 | $5,501 | $233,680 | $20,000 | $213,680 |
| 2021 | $7,935 | $195,160 | $20,000 | $175,160 |
| 2020 | $5,524 | $196,360 | $20,000 | $176,360 |
| 2019 | $7,949 | $201,240 | $20,000 | $181,240 |
| 2018 | $5,457 | $208,680 | $20,000 | $188,680 |
| 2017 | $4,981 | $201,480 | $32,840 | $168,640 |
| 2016 | $4,896 | $188,000 | $32,840 | $155,160 |
| 2015 | $6,717 | $165,480 | $32,840 | $132,640 |
| 2014 | $9,308 | $180,000 | $0 | $0 |
Source: Public Records
Map
Nearby Homes
Your Personal Tour Guide
Ask me questions while you tour the home.