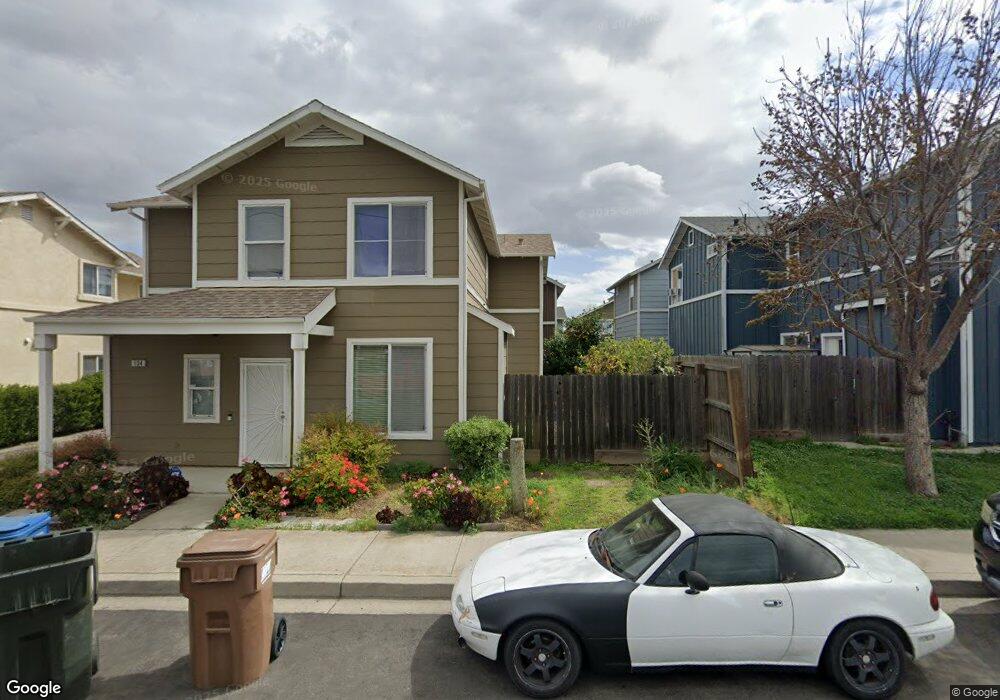
138 Fairview Ave Bay Point, CA 94565
Anuta Park NeighborhoodEstimated Value: $514,000 - $630,000
3
Beds
3
Baths
1,448
Sq Ft
$385/Sq Ft
Est. Value
About This Home
This home is located at 138 Fairview Ave, Bay Point, CA 94565 and is currently estimated at $558,053, approximately $385 per square foot. 138 Fairview Ave is a home located in Contra Costa County with nearby schools including Bel Air Elementary School, Riverview Middle School, and Mt. Diablo High School.
Ownership History
Date
Name
Owned For
Owner Type
Purchase Details
Closed on
Aug 8, 2016
Sold by
Warrick Marilyn
Bought by
Warrick Marilyn
Current Estimated Value
Home Financials for this Owner
Home Financials are based on the most recent Mortgage that was taken out on this home.
Original Mortgage
$299,511
Outstanding Balance
$238,975
Interest Rate
3.48%
Mortgage Type
FHA
Estimated Equity
$319,078
Purchase Details
Closed on
Aug 27, 2015
Sold by
Warrick Marilyn D
Bought by
Warrick Marilyn
Purchase Details
Closed on
Sep 7, 2004
Sold by
Obg At Bay Point Llc
Bought by
Warrick Marilyn D
Home Financials for this Owner
Home Financials are based on the most recent Mortgage that was taken out on this home.
Original Mortgage
$270,835
Interest Rate
4.87%
Mortgage Type
Purchase Money Mortgage
Create a Home Valuation Report for This Property
The Home Valuation Report is an in-depth analysis detailing your home's value as well as a comparison with similar homes in the area
Home Values in the Area
Average Home Value in this Area
Purchase History
| Date | Buyer | Sale Price | Title Company |
|---|---|---|---|
| Warrick Marilyn | -- | North American Title | |
| Warrick Marilyn | -- | North American Title Co Inc | |
| Warrick Marilyn | -- | None Available | |
| Warrick Marilyn D | $339,000 | First American Title |
Source: Public Records
Mortgage History
| Date | Status | Borrower | Loan Amount |
|---|---|---|---|
| Open | Warrick Marilyn | $299,511 | |
| Previous Owner | Warrick Marilyn D | $270,835 | |
| Closed | Warrick Marilyn D | $67,708 |
Source: Public Records
Tax History
| Year | Tax Paid | Tax Assessment Tax Assessment Total Assessment is a certain percentage of the fair market value that is determined by local assessors to be the total taxable value of land and additions on the property. | Land | Improvement |
|---|---|---|---|---|
| 2025 | $6,449 | $471,818 | $214,652 | $257,166 |
| 2024 | $6,150 | $462,568 | $210,444 | $252,124 |
| 2023 | $6,150 | $453,499 | $206,318 | $247,181 |
| 2022 | $6,015 | $444,608 | $202,273 | $242,335 |
| 2021 | $5,868 | $435,891 | $198,307 | $237,584 |
| 2019 | $5,636 | $415,000 | $188,803 | $226,197 |
| 2018 | $5,030 | $370,000 | $168,331 | $201,669 |
| 2017 | $4,789 | $355,000 | $161,506 | $193,494 |
| 2016 | $4,580 | $341,000 | $155,136 | $185,864 |
| 2015 | $3,778 | $268,000 | $121,926 | $146,074 |
| 2014 | $3,155 | $213,000 | $96,904 | $116,096 |
Source: Public Records
Map
Nearby Homes
- 64 Solano Ave
- 179 Crivello Ave
- 64 S Bella Monte Ave
- 1988 Calaveras Dr
- 1998 Calaveras Dr
- 2171 Rain Drop Cir
- 79 Bella Vista Ave
- 0 Mountain View Ave
- 24 Mountain View Ave
- 68 - 76 Bayview Ave
- 2867 Willow Pass Rd
- 191 Maureen Cir
- 135 Manor Dr
- 346 Melanie Dr
- 113 Loftus Rd
- 641 Chadwick Ln
- 3 Lancaster Cir Unit 211
- 168 Loftus Rd
- 7 Lancaster Cir Unit 137
- 66 Ambrose Ave
- 142 Fairview Ave
- 126 Fairview Ave
- 134 Fairview Ave
- 151 Gibson Ave
- 155 Gibson Ave
- 146 Fairview Ave
- 130 Fairview Ave
- 147 Gibson Ave
- 159 Gibson Ave
- 154 Fairview Ave
- 122 Fairview Ave
- 143 Gibson Ave
- 150 Fairview Ave
- 118 Fairview Ave
- 163 Gibson Ave
- 139 Gibson Ave
- 114 Fairview Ave
- 162 Fairview Ave
- 110 Fairview Ave
- 167 Gibson Ave
Your Personal Tour Guide
Ask me questions while you tour the home.