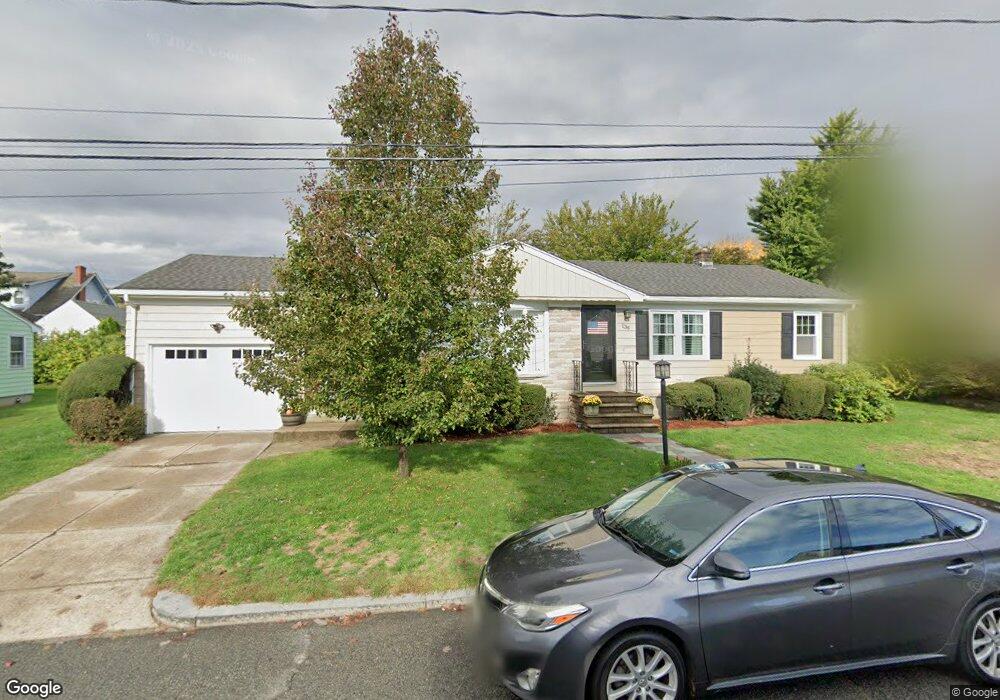
138 Hilary Dr Providence, RI 02908
Mount Pleasant NeighborhoodEstimated Value: $393,412 - $425,000
3
Beds
1
Bath
1,202
Sq Ft
$345/Sq Ft
Est. Value
About This Home
This home is located at 138 Hilary Dr, Providence, RI 02908 and is currently estimated at $415,103, approximately $345 per square foot. 138 Hilary Dr is a home located in Providence County with nearby schools including Charles N. Fortes Elementary School, Asa Messer Elementary School, and Veazie Street Elementary School.
Ownership History
Date
Name
Owned For
Owner Type
Purchase Details
Closed on
Apr 30, 2007
Sold by
Picozzi Eva
Bought by
Aubin Christopher J and Mcelroy David E
Current Estimated Value
Home Financials for this Owner
Home Financials are based on the most recent Mortgage that was taken out on this home.
Original Mortgage
$207,100
Interest Rate
6.18%
Mortgage Type
Purchase Money Mortgage
Create a Home Valuation Report for This Property
The Home Valuation Report is an in-depth analysis detailing your home's value as well as a comparison with similar homes in the area
Home Values in the Area
Average Home Value in this Area
Purchase History
| Date | Buyer | Sale Price | Title Company |
|---|---|---|---|
| Aubin Christopher J | $218,000 | -- |
Source: Public Records
Mortgage History
| Date | Status | Borrower | Loan Amount |
|---|---|---|---|
| Open | Aubin Christopher J | $166,500 | |
| Closed | Aubin Christopher J | $207,100 |
Source: Public Records
Tax History Compared to Growth
Tax History
| Year | Tax Paid | Tax Assessment Tax Assessment Total Assessment is a certain percentage of the fair market value that is determined by local assessors to be the total taxable value of land and additions on the property. | Land | Improvement |
|---|---|---|---|---|
| 2025 | $3,068 | $365,200 | $166,900 | $198,300 |
| 2024 | $5,155 | $280,900 | $108,500 | $172,400 |
| 2023 | $5,155 | $280,900 | $108,500 | $172,400 |
| 2022 | $5,000 | $280,900 | $108,500 | $172,400 |
| 2021 | $5,207 | $212,000 | $89,100 | $122,900 |
| 2020 | $5,207 | $212,000 | $89,100 | $122,900 |
| 2019 | $5,207 | $212,000 | $89,100 | $122,900 |
| 2018 | $5,110 | $159,900 | $71,700 | $88,200 |
| 2017 | $5,037 | $157,600 | $71,700 | $85,900 |
| 2016 | $5,037 | $157,600 | $71,700 | $85,900 |
| 2015 | $4,852 | $146,600 | $71,700 | $74,900 |
| 2014 | $4,948 | $146,600 | $71,700 | $74,900 |
| 2013 | $4,948 | $146,600 | $71,700 | $74,900 |
Source: Public Records
Map
Nearby Homes