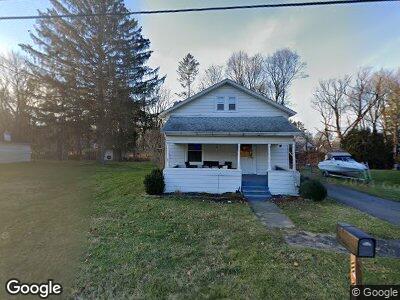
138 Kent Blvd Ilion, NY 13357
East Frankfort NeighborhoodEstimated Value: $138,000 - $157,000
3
Beds
1
Bath
1,452
Sq Ft
$103/Sq Ft
Est. Value
About This Home
This home is located at 138 Kent Blvd, Ilion, NY 13357 and is currently estimated at $149,903, approximately $103 per square foot. 138 Kent Blvd is a home located in Herkimer County with nearby schools including Harry M. Fisher Elementary School, Barringer Road Elementary School, and Gregory B. Jarvis Middle School.
Ownership History
Date
Name
Owned For
Owner Type
Purchase Details
Closed on
Feb 16, 2012
Sold by
Polidori Fka Perry Holly
Bought by
Arsenault Cynthia
Current Estimated Value
Home Financials for this Owner
Home Financials are based on the most recent Mortgage that was taken out on this home.
Original Mortgage
$82,747
Interest Rate
4.4%
Mortgage Type
FHA
Purchase Details
Closed on
Apr 3, 2006
Sold by
Bush Laura M By
Bought by
Perry Holly M
Create a Home Valuation Report for This Property
The Home Valuation Report is an in-depth analysis detailing your home's value as well as a comparison with similar homes in the area
Home Values in the Area
Average Home Value in this Area
Purchase History
| Date | Buyer | Sale Price | Title Company |
|---|---|---|---|
| Arsenault Cynthia | $84,900 | Bruce Daniels | |
| Perry Holly M | $60,420 | -- |
Source: Public Records
Mortgage History
| Date | Status | Borrower | Loan Amount |
|---|---|---|---|
| Open | Kran Ryan J | $10,000 | |
| Open | Kran Ryan J | $74,925 | |
| Closed | Arsenault Cynthia | $82,747 |
Source: Public Records
Tax History Compared to Growth
Tax History
| Year | Tax Paid | Tax Assessment Tax Assessment Total Assessment is a certain percentage of the fair market value that is determined by local assessors to be the total taxable value of land and additions on the property. | Land | Improvement |
|---|---|---|---|---|
| 2024 | $2,696 | $55,500 | $8,300 | $47,200 |
| 2023 | $2,696 | $55,500 | $8,300 | $47,200 |
| 2022 | $2,672 | $55,500 | $8,300 | $47,200 |
| 2021 | $2,716 | $55,500 | $8,300 | $47,200 |
| 2020 | $2,700 | $55,500 | $8,300 | $47,200 |
| 2019 | $2,559 | $55,500 | $8,300 | $47,200 |
| 2018 | $2,675 | $55,500 | $8,300 | $47,200 |
| 2017 | $2,568 | $55,500 | $8,300 | $47,200 |
| 2016 | $2,550 | $55,500 | $8,300 | $47,200 |
| 2015 | -- | $55,500 | $8,300 | $47,200 |
| 2014 | -- | $55,500 | $8,300 | $47,200 |
Source: Public Records
Map
Nearby Homes