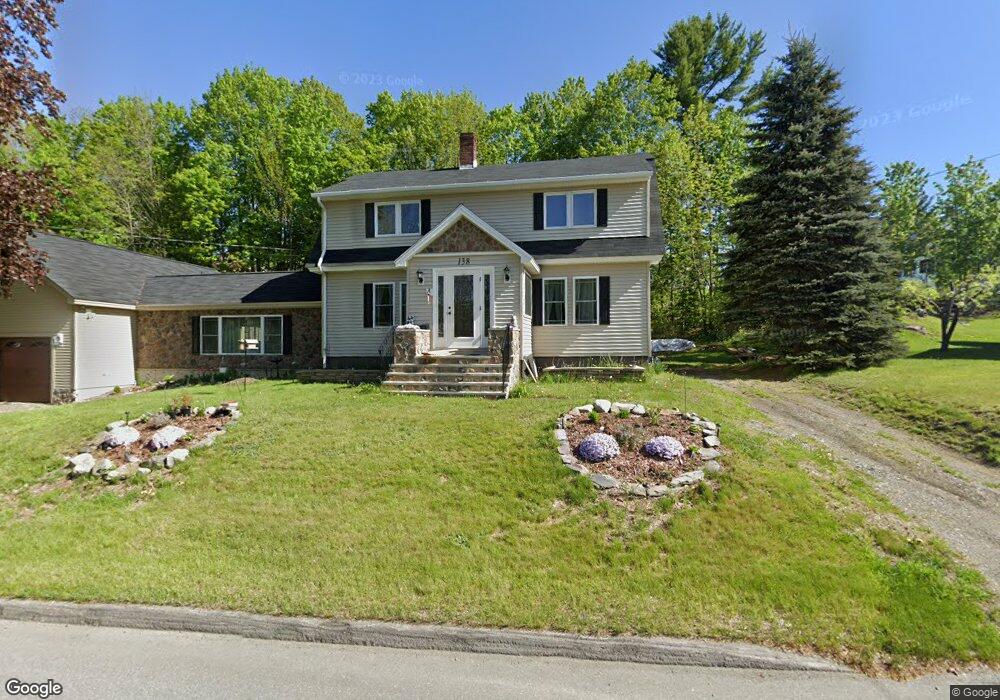
138 Lawrence St Dover Foxcroft, ME 04426
Estimated Value: $228,000 - $246,000
3
Beds
2
Baths
1,537
Sq Ft
$156/Sq Ft
Est. Value
About This Home
This home is located at 138 Lawrence St, Dover Foxcroft, ME 04426 and is currently estimated at $239,854, approximately $156 per square foot. 138 Lawrence St is a home located in Piscataquis County with nearby schools including Se Do Mo Cha Elementary School, Se Do Mo Cha Middle School, and Foxcroft Academy.
Ownership History
Date
Name
Owned For
Owner Type
Purchase Details
Closed on
Oct 9, 2018
Sold by
Boardway Lee A
Bought by
Boardway Lee A and Boardway Jeyashree
Current Estimated Value
Purchase Details
Closed on
Jul 9, 2014
Sold by
Boardway Geraldine C Est
Bought by
Boardway Lee A
Create a Home Valuation Report for This Property
The Home Valuation Report is an in-depth analysis detailing your home's value as well as a comparison with similar homes in the area
Home Values in the Area
Average Home Value in this Area
Purchase History
| Date | Buyer | Sale Price | Title Company |
|---|---|---|---|
| Boardway Lee A | -- | -- | |
| Boardway Lee A | -- | -- |
Source: Public Records
Tax History Compared to Growth
Tax History
| Year | Tax Paid | Tax Assessment Tax Assessment Total Assessment is a certain percentage of the fair market value that is determined by local assessors to be the total taxable value of land and additions on the property. | Land | Improvement |
|---|---|---|---|---|
| 2024 | $3,607 | $212,200 | $23,700 | $188,500 |
| 2023 | $3,211 | $173,100 | $21,800 | $151,300 |
| 2022 | $3,064 | $153,200 | $20,000 | $133,200 |
| 2021 | $2,900 | $134,900 | $18,200 | $116,700 |
| 2020 | $2,110 | $98,600 | $18,200 | $80,400 |
| 2019 | $2,120 | $98,600 | $18,200 | $80,400 |
| 2018 | $2,090 | $98,600 | $18,200 | $80,400 |
| 2017 | $2,061 | $98,600 | $18,200 | $80,400 |
| 2016 | $1,997 | $98,600 | $18,200 | $80,400 |
| 2015 | $1,834 | $98,600 | $18,200 | $80,400 |
| 2014 | $1,799 | $98,600 | $18,200 | $80,400 |
| 2013 | $1,740 | $98,600 | $18,200 | $80,400 |
Source: Public Records
Map
Nearby Homes