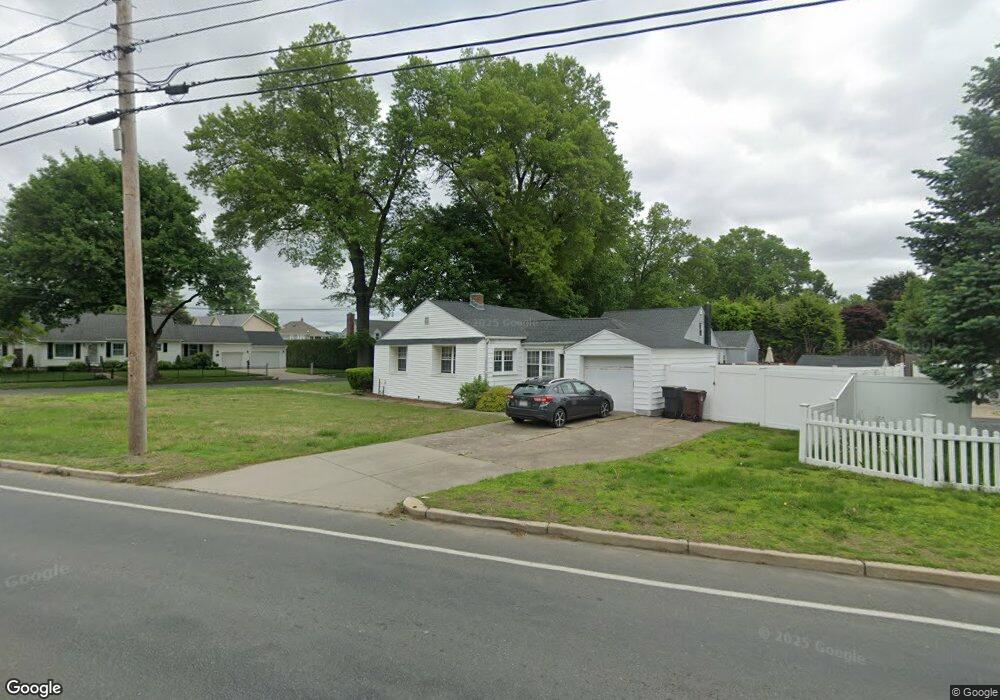
138 Lindbergh Blvd Westfield, MA 01085
Estimated Value: $310,620 - $350,000
3
Beds
1
Bath
1,331
Sq Ft
$248/Sq Ft
Est. Value
About This Home
This home is located at 138 Lindbergh Blvd, Westfield, MA 01085 and is currently estimated at $330,155, approximately $248 per square foot. 138 Lindbergh Blvd is a home located in Hampden County with nearby schools including Westfield High School and Saint Mary High School.
Ownership History
Date
Name
Owned For
Owner Type
Purchase Details
Closed on
May 26, 2010
Sold by
Sorcinelli Ines and Sorcinelli Eugenio G
Bought by
Burnett Gianina L
Current Estimated Value
Home Financials for this Owner
Home Financials are based on the most recent Mortgage that was taken out on this home.
Original Mortgage
$120,000
Outstanding Balance
$81,053
Interest Rate
5.13%
Mortgage Type
Purchase Money Mortgage
Estimated Equity
$249,102
Create a Home Valuation Report for This Property
The Home Valuation Report is an in-depth analysis detailing your home's value as well as a comparison with similar homes in the area
Home Values in the Area
Average Home Value in this Area
Purchase History
| Date | Buyer | Sale Price | Title Company |
|---|---|---|---|
| Burnett Gianina L | $150,000 | -- |
Source: Public Records
Mortgage History
| Date | Status | Borrower | Loan Amount |
|---|---|---|---|
| Open | Burnett Gianina L | $120,000 |
Source: Public Records
Tax History
| Year | Tax Paid | Tax Assessment Tax Assessment Total Assessment is a certain percentage of the fair market value that is determined by local assessors to be the total taxable value of land and additions on the property. | Land | Improvement |
|---|---|---|---|---|
| 2025 | $4,112 | $270,900 | $98,500 | $172,400 |
| 2024 | $4,181 | $261,800 | $89,400 | $172,400 |
| 2023 | $4,011 | $236,200 | $85,300 | $150,900 |
| 2022 | $3,861 | $208,800 | $76,100 | $132,700 |
| 2021 | $1,809 | $197,800 | $71,700 | $126,100 |
| 2020 | $3,617 | $187,900 | $71,700 | $116,200 |
| 2019 | $3,533 | $179,600 | $68,300 | $111,300 |
| 2018 | $3,477 | $179,600 | $68,300 | $111,300 |
| 2017 | $3,410 | $175,600 | $69,300 | $106,300 |
| 2016 | $3,414 | $175,600 | $69,300 | $106,300 |
| 2015 | $3,256 | $175,600 | $69,300 | $106,300 |
| 2014 | $2,433 | $175,600 | $69,300 | $106,300 |
Source: Public Records
Map
Nearby Homes
- 130 Lindbergh Blvd
- 44 E Silver St
- 45 E Silver St
- 133 Lindbergh Blvd
- 47 E Silver St
- 47 E Silver St Unit 1
- 47 E Silver St Unit 2
- 131 Lindbergh Blvd
- 43 E Silver St
- 122 Lindbergh Blvd
- 125 Lindbergh Blvd
- 38 E Silver St
- 48 E Silver St
- 48 E Silver St Unit 2
- 48 E Silver St Unit 6
- 48 E Silver St Unit 4
- 48 E Silver St Unit 4 & 6
- 42 Cross St
- 119 Lindbergh Blvd
- 114 Lindbergh Blvd
Your Personal Tour Guide
Ask me questions while you tour the home.