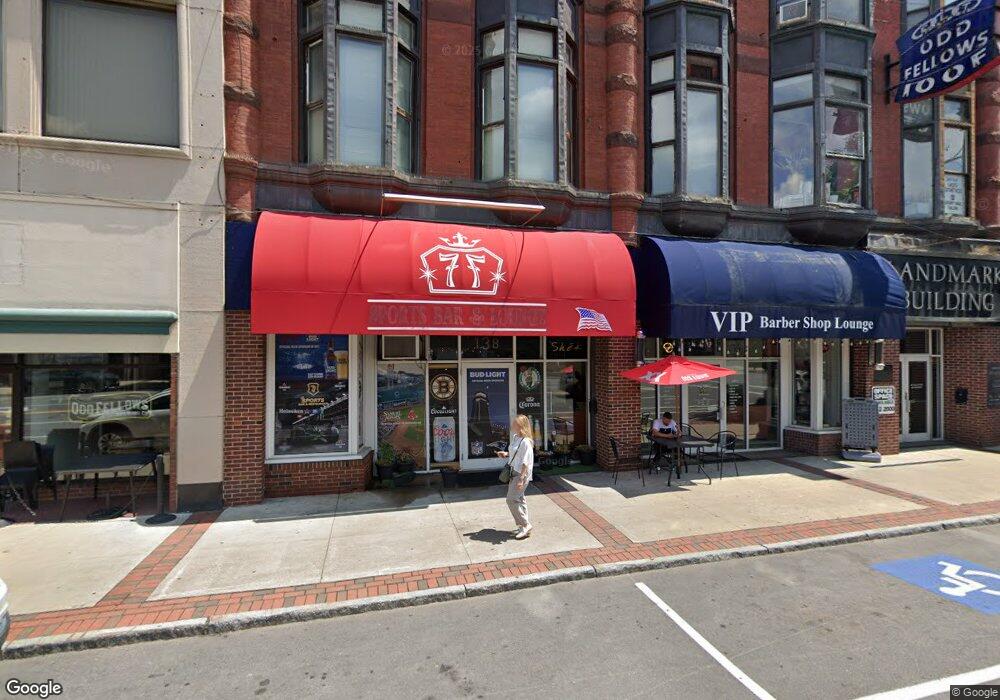
138 Main St Nashua, NH 03060
Downtown Nashua NeighborhoodEstimated Value: $5,110,266
--
Bed
--
Bath
43,336
Sq Ft
$118/Sq Ft
Est. Value
About This Home
This home is located at 138 Main St, Nashua, NH 03060 and is currently estimated at $5,110,266, approximately $117 per square foot. 138 Main St is a home located in Hillsborough County with nearby schools including Amherst Street School, Pennichuck Middle School, and Nashua High School North.
Ownership History
Date
Name
Owned For
Owner Type
Purchase Details
Closed on
Mar 19, 2020
Sold by
Ferris Partners Ltd
Bought by
Whiting Building Llc
Current Estimated Value
Home Financials for this Owner
Home Financials are based on the most recent Mortgage that was taken out on this home.
Original Mortgage
$1,025,000
Outstanding Balance
$902,090
Interest Rate
3.4%
Mortgage Type
Purchase Money Mortgage
Estimated Equity
$4,208,176
Purchase Details
Closed on
Feb 27, 2002
Sold by
Wilcox Rodger F and Wilcox Kathy K
Bought by
Ferris Partners Ltd
Create a Home Valuation Report for This Property
The Home Valuation Report is an in-depth analysis detailing your home's value as well as a comparison with similar homes in the area
Home Values in the Area
Average Home Value in this Area
Purchase History
| Date | Buyer | Sale Price | Title Company |
|---|---|---|---|
| Whiting Building Llc | $2,900,000 | None Available | |
| Ferris Partners Ltd | $1,260,000 | -- |
Source: Public Records
Mortgage History
| Date | Status | Borrower | Loan Amount |
|---|---|---|---|
| Open | Whiting Building Llc | $1,025,000 |
Source: Public Records
Tax History Compared to Growth
Tax History
| Year | Tax Paid | Tax Assessment Tax Assessment Total Assessment is a certain percentage of the fair market value that is determined by local assessors to be the total taxable value of land and additions on the property. | Land | Improvement |
|---|---|---|---|---|
| 2024 | $29,328 | $1,844,500 | $223,000 | $1,621,500 |
| 2023 | $30,727 | $1,685,500 | $194,000 | $1,491,500 |
| 2022 | $30,457 | $1,685,500 | $194,000 | $1,491,500 |
| 2021 | $39,644 | $1,707,300 | $157,000 | $1,550,300 |
| 2020 | $38,602 | $1,707,300 | $157,000 | $1,550,300 |
| 2019 | $37,151 | $1,707,300 | $157,000 | $1,550,300 |
| 2018 | $33,914 | $1,707,300 | $157,000 | $1,550,300 |
| 2017 | $33,447 | $1,296,900 | $172,500 | $1,124,400 |
| 2016 | $32,513 | $1,296,900 | $172,500 | $1,124,400 |
| 2015 | $31,813 | $1,296,900 | $172,500 | $1,124,400 |
| 2014 | -- | $1,296,900 | $172,500 | $1,124,400 |
Source: Public Records
Map
Nearby Homes
- 52 Main St Unit 402
- 5 Mulberry St
- 11 Charles St
- 38 Central St
- 18 Harbor Ave Unit 208
- 8 Buck St Unit 10
- 30 Ledge St
- 24 E Otterson St
- 13 Mulvanity St
- 22 Wilder St
- 13 Sapphire Ln
- 155 Tolles St
- 29 Wilder St
- 4 Badger St
- 15 Atherton Ave
- 19 Atherton Ave
- 0 Baldwin St
- 36-38 Courtland St
- 121 Palm St
- 2 Lyons St