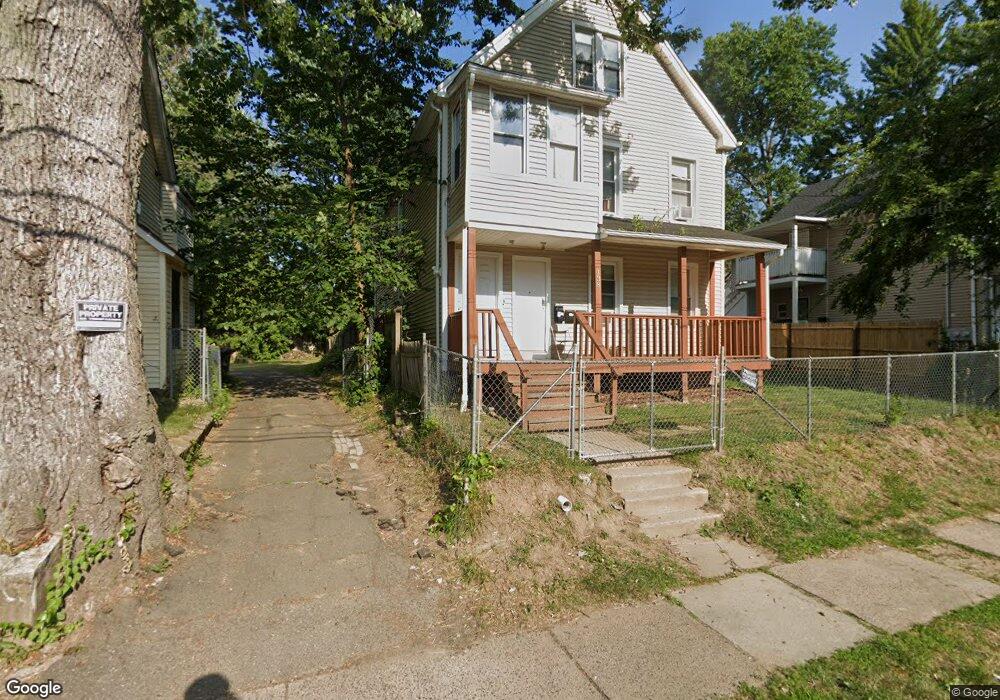
138 Martin St Hartford, CT 06120
North End NeighborhoodEstimated Value: $184,135 - $294,000
7
Beds
3
Baths
2,554
Sq Ft
$84/Sq Ft
Est. Value
About This Home
This home is located at 138 Martin St, Hartford, CT 06120 and is currently estimated at $214,034, approximately $83 per square foot. 138 Martin St is a home located in Hartford County with nearby schools including Capital Preparatory Magnet School, Perry Elementary School, and Ib Global Communications Academy.
Ownership History
Date
Name
Owned For
Owner Type
Purchase Details
Closed on
Jul 25, 2025
Sold by
Creative Residencies Llc
Bought by
Stainrod Lorane and Brown Suzette
Current Estimated Value
Purchase Details
Closed on
Sep 20, 2019
Sold by
Acosta Luis
Bought by
Creative Residencies Llc
Purchase Details
Closed on
Mar 10, 2008
Sold by
Consumer Solutions T
Bought by
Acosta Luis
Home Financials for this Owner
Home Financials are based on the most recent Mortgage that was taken out on this home.
Original Mortgage
$89,000
Interest Rate
15%
Mortgage Type
Purchase Money Mortgage
Purchase Details
Closed on
Apr 13, 2006
Sold by
Zacchary Llc
Bought by
Stapleton Lisa
Purchase Details
Closed on
Nov 5, 2002
Sold by
Chambers Michael and Edwards Angela
Bought by
Edwards Angela
Purchase Details
Closed on
Aug 16, 2002
Sold by
Pledged Prop 2 Llc
Bought by
Chambers Michael and Williams Caroline
Purchase Details
Closed on
Jan 21, 1999
Sold by
Rochester James and Rochester Beulah
Bought by
Freeman Associates Llc
Create a Home Valuation Report for This Property
The Home Valuation Report is an in-depth analysis detailing your home's value as well as a comparison with similar homes in the area
Home Values in the Area
Average Home Value in this Area
Purchase History
| Date | Buyer | Sale Price | Title Company |
|---|---|---|---|
| Stainrod Lorane | $185,000 | -- | |
| Creative Residencies Llc | -- | -- | |
| Acosta Luis | $64,000 | -- | |
| Acosta Luis | $64,000 | -- | |
| Stapleton Lisa | $160,000 | -- | |
| Stapleton Lisa | $160,000 | -- | |
| Edwards Angela | $95,000 | -- | |
| Edwards Angela | $95,000 | -- | |
| Chambers Michael | $39,000 | -- | |
| Chambers Michael | $39,000 | -- | |
| Freeman Associates Llc | $35,000 | -- | |
| Freeman Associates Llc | $35,000 | -- |
Source: Public Records
Mortgage History
| Date | Status | Borrower | Loan Amount |
|---|---|---|---|
| Previous Owner | Freeman Associates Llc | $89,000 |
Source: Public Records
Tax History Compared to Growth
Tax History
| Year | Tax Paid | Tax Assessment Tax Assessment Total Assessment is a certain percentage of the fair market value that is determined by local assessors to be the total taxable value of land and additions on the property. | Land | Improvement |
|---|---|---|---|---|
| 2025 | $5,608 | $81,328 | $3,785 | $77,543 |
| 2024 | $5,608 | $81,328 | $3,785 | $77,543 |
| 2023 | $5,608 | $81,328 | $3,785 | $77,543 |
| 2022 | $5,608 | $81,328 | $3,785 | $77,543 |
| 2021 | $3,445 | $46,375 | $3,395 | $42,980 |
| 2020 | $3,445 | $46,375 | $3,395 | $42,980 |
| 2019 | $3,445 | $46,375 | $3,395 | $42,980 |
| 2018 | $3,329 | $44,812 | $3,281 | $41,531 |
| 2016 | $3,032 | $40,810 | $3,124 | $37,686 |
| 2015 | $2,888 | $38,872 | $2,976 | $35,896 |
| 2014 | $2,817 | $37,921 | $2,903 | $35,018 |
Source: Public Records
Map
Nearby Homes
- 158 Martin St Unit 160
- 25 Judson St Unit C
- 142 Clark St
- 238 Enfield St Unit 240
- 275 Westland St
- 551 Garden St Unit 553
- 147 Enfield St Unit 149
- 39 Capen St
- 50 Mansfield St
- 2657 Main St Unit 2659
- 59 Mansfield St Unit 61
- 35 Loomis St
- 87 Mansfield St Unit 89
- 33 Warren St
- 270 Bellevue St
- 33 E Raymond St Unit 35
- 67 Enfield St Unit 37
- 186 Brook St Unit 188
- 183 Brook St Unit 185
- 75 Cleveland Ave
- 140 Martin St
- 136 Martin St
- 70 Judson St
- 134 Martin St
- 134 Martin St Unit 2
- 68 Judson St
- 158 Martin St Unit 2
- 158 Martin St Unit 3
- 72 Judson St
- 162 Martin St Unit 164
- 149 Martin St
- 147 Martin St
- 147 Martin St Unit 1
- 56 Judson St Unit 58
- 60 Judson St Unit 62
- 128 Martin St
- 166 Martin St Unit 168
- 149 Barbour St
- 174 Martin St Unit 176
- 67 Judson St Unit 69