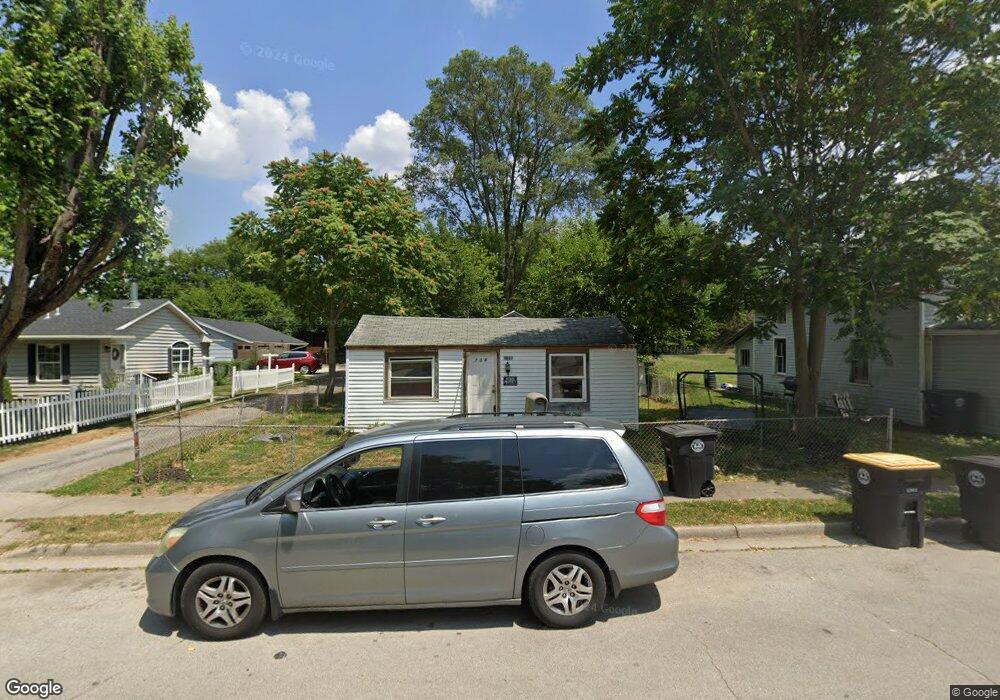
138 N Main St Covington, OH 45318
Estimated Value: $21,000 - $96,000
2
Beds
1
Bath
438
Sq Ft
$129/Sq Ft
Est. Value
About This Home
This home is located at 138 N Main St, Covington, OH 45318 and is currently estimated at $56,401, approximately $128 per square foot. 138 N Main St is a home located in Miami County with nearby schools including Covington Elementary/Junior High School, Covington Junior High School, and Covington High School.
Ownership History
Date
Name
Owned For
Owner Type
Purchase Details
Closed on
Aug 1, 2025
Sold by
Workman Arthur
Bought by
Duffey Asher Real Estate Llc
Current Estimated Value
Purchase Details
Closed on
Jun 4, 2021
Sold by
Workman Arthur
Bought by
Evans Megan
Purchase Details
Closed on
Feb 13, 2019
Sold by
Workman Arthur
Bought by
Evans Joseph and Evans Megan
Home Financials for this Owner
Home Financials are based on the most recent Mortgage that was taken out on this home.
Original Mortgage
$31,000
Interest Rate
7.5%
Mortgage Type
Land Contract Argmt. Of Sale
Purchase Details
Closed on
Feb 23, 2012
Sold by
Land Bruce E and Land Cherie K
Bought by
Workman Arthur
Purchase Details
Closed on
Aug 21, 2006
Sold by
Ganger Russel Paul and Ganger Cora
Bought by
Land Bruce E
Purchase Details
Closed on
Jan 1, 1990
Bought by
Ganger Russel Paul
Create a Home Valuation Report for This Property
The Home Valuation Report is an in-depth analysis detailing your home's value as well as a comparison with similar homes in the area
Home Values in the Area
Average Home Value in this Area
Purchase History
| Date | Buyer | Sale Price | Title Company |
|---|---|---|---|
| Duffey Asher Real Estate Llc | $22,000 | None Listed On Document | |
| Evans Megan | -- | None Available | |
| Evans Joseph | $31,000 | None Available | |
| Workman Arthur | $15,000 | -- | |
| Workman Arthur | $15,000 | -- | |
| Land Bruce E | $15,000 | -- | |
| Ganger Russel Paul | -- | -- |
Source: Public Records
Mortgage History
| Date | Status | Borrower | Loan Amount |
|---|---|---|---|
| Previous Owner | Evans Joseph | $31,000 |
Source: Public Records
Tax History
| Year | Tax Paid | Tax Assessment Tax Assessment Total Assessment is a certain percentage of the fair market value that is determined by local assessors to be the total taxable value of land and additions on the property. | Land | Improvement |
|---|---|---|---|---|
| 2025 | $481 | $14,390 | $8,120 | $6,270 |
| 2024 | $481 | $13,020 | $8,820 | $4,200 |
| 2023 | $499 | $13,020 | $8,820 | $4,200 |
| 2022 | $498 | $13,020 | $8,820 | $4,200 |
| 2021 | $413 | $10,010 | $6,790 | $3,220 |
| 2020 | $414 | $10,010 | $6,790 | $3,220 |
| 2019 | $416 | $10,010 | $6,790 | $3,220 |
| 2018 | $335 | $8,060 | $5,290 | $2,770 |
| 2017 | $341 | $8,060 | $5,290 | $2,770 |
| 2016 | $337 | $8,060 | $5,290 | $2,770 |
| 2015 | $311 | $7,740 | $5,080 | $2,660 |
| 2014 | $311 | $7,740 | $5,080 | $2,660 |
| 2013 | $300 | $7,740 | $5,080 | $2,660 |
Source: Public Records
Map
Nearby Homes
Your Personal Tour Guide
Ask me questions while you tour the home.