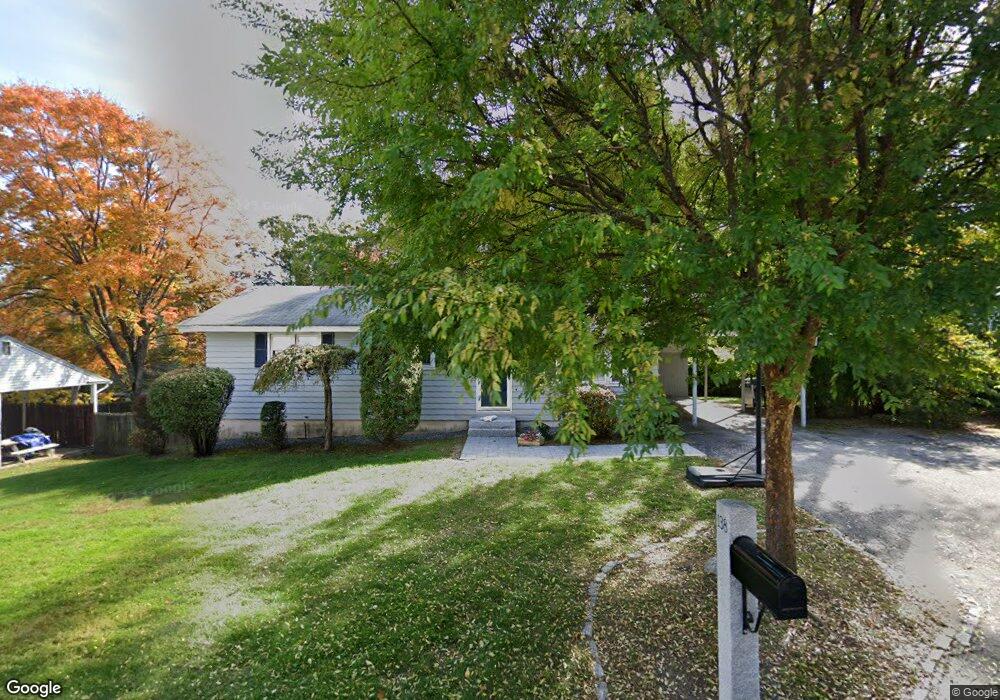
138 Plymouth Street Extension Bedford, NH 03110
Bedford NeighborhoodEstimated Value: $398,000 - $451,000
3
Beds
2
Baths
1,812
Sq Ft
$238/Sq Ft
Est. Value
About This Home
This home is located at 138 Plymouth Street Extension, Bedford, NH 03110 and is currently estimated at $430,837, approximately $237 per square foot. 138 Plymouth Street Extension is a home located in Hillsborough County with nearby schools including Mckelvie Intermediate School, Ross A. Lurgio Middle School, and Bedford High School.
Ownership History
Date
Name
Owned For
Owner Type
Purchase Details
Closed on
Mar 17, 2010
Sold by
Filion Matthew R and Filion Stacy
Bought by
Mason Christopher S
Current Estimated Value
Home Financials for this Owner
Home Financials are based on the most recent Mortgage that was taken out on this home.
Original Mortgage
$229,500
Outstanding Balance
$152,639
Interest Rate
5.05%
Mortgage Type
Purchase Money Mortgage
Estimated Equity
$278,198
Purchase Details
Closed on
Jul 21, 2005
Sold by
Cybul Joseph S
Bought by
Filion Matthew R and Filion Stacy
Home Financials for this Owner
Home Financials are based on the most recent Mortgage that was taken out on this home.
Original Mortgage
$195,920
Interest Rate
5.59%
Purchase Details
Closed on
Mar 19, 2003
Sold by
Hall John L and Hall Laurette M
Bought by
Cybul Joseph S and Cybul Kimberly J
Create a Home Valuation Report for This Property
The Home Valuation Report is an in-depth analysis detailing your home's value as well as a comparison with similar homes in the area
Home Values in the Area
Average Home Value in this Area
Purchase History
| Date | Buyer | Sale Price | Title Company |
|---|---|---|---|
| Mason Christopher S | $225,000 | -- | |
| Filion Matthew R | $244,900 | -- | |
| Cybul Joseph S | $199,900 | -- |
Source: Public Records
Mortgage History
| Date | Status | Borrower | Loan Amount |
|---|---|---|---|
| Open | Cybul Joseph S | $229,500 | |
| Previous Owner | Cybul Joseph S | $192,000 | |
| Previous Owner | Cybul Joseph S | $23,300 | |
| Previous Owner | Cybul Joseph S | $195,920 |
Source: Public Records
Tax History Compared to Growth
Tax History
| Year | Tax Paid | Tax Assessment Tax Assessment Total Assessment is a certain percentage of the fair market value that is determined by local assessors to be the total taxable value of land and additions on the property. | Land | Improvement |
|---|---|---|---|---|
| 2024 | $5,737 | $362,900 | $187,600 | $175,300 |
| 2023 | $5,371 | $362,900 | $187,600 | $175,300 |
| 2022 | $5,273 | $299,600 | $138,900 | $160,700 |
| 2021 | $5,135 | $299,600 | $138,900 | $160,700 |
| 2020 | $4,817 | $240,600 | $100,900 | $139,700 |
| 2019 | $4,559 | $240,600 | $100,900 | $139,700 |
| 2018 | $4,423 | $216,800 | $95,000 | $121,800 |
| 2017 | $3,183 | $216,800 | $95,000 | $121,800 |
| 2016 | $4,295 | $192,000 | $71,200 | $120,800 |
| 2015 | $4,370 | $192,000 | $71,200 | $120,800 |
| 2014 | $4,320 | $192,000 | $71,200 | $120,800 |
| 2013 | $4,257 | $192,000 | $71,200 | $120,800 |
Source: Public Records
Map
Nearby Homes
- 136 Plymouth Street Extension
- 140 Plymouth Street Extension
- 130 Plymouth St
- 133 Plymouth Street Extension
- 7 First St
- 131 Plymouth St
- 5 First St
- 47 Nourie Park
- 120 Rockland Ave
- 124 Plymouth St
- 65 1st St Unit 1
- 108 Rockland Ave
- 152 Rockland Ave
- 8 First St
- 10 1st St
- 10-1 Grapevine
- 162 Rockland Ave
- 29 Nourie Park
- 96 Rockland Ave
- 10 First St