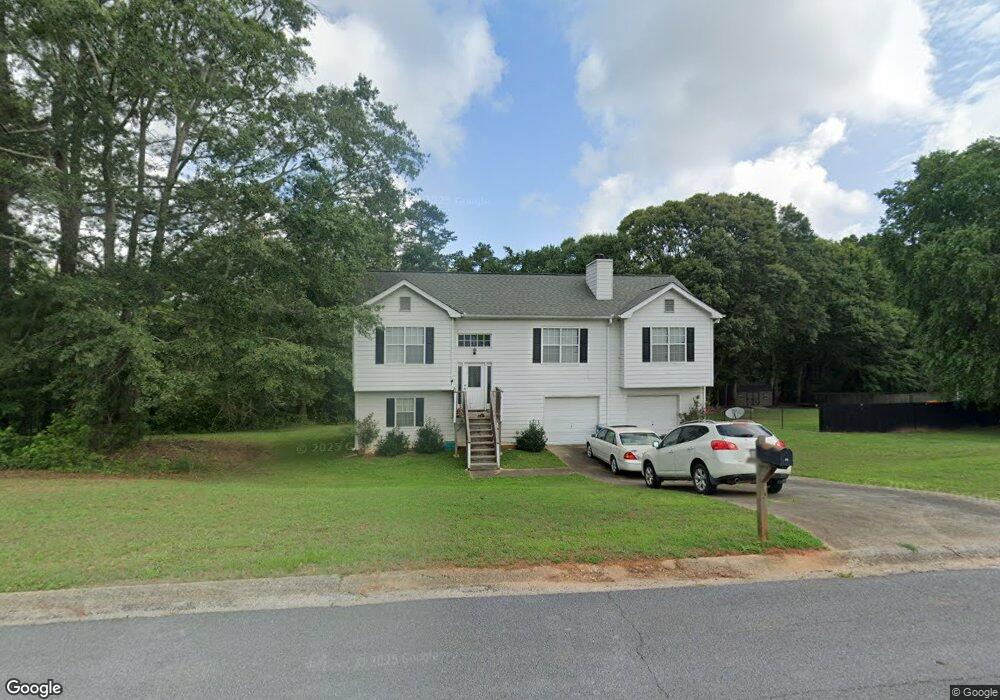
138 Thorn Brook Rd Bethlehem, GA 30620
Estimated Value: $295,000 - $321,000
4
Beds
3
Baths
1,842
Sq Ft
$166/Sq Ft
Est. Value
About This Home
This home is located at 138 Thorn Brook Rd, Bethlehem, GA 30620 and is currently estimated at $305,887, approximately $166 per square foot. 138 Thorn Brook Rd is a home located in Barrow County with nearby schools including Bethlehem Elementary School, Haymon-Morris Middle School, and Apalachee High School.
Ownership History
Date
Name
Owned For
Owner Type
Purchase Details
Closed on
Apr 14, 2010
Sold by
Gaines Kenneth N
Bought by
Gaines Kenneth N and Gaines Marie T
Current Estimated Value
Home Financials for this Owner
Home Financials are based on the most recent Mortgage that was taken out on this home.
Original Mortgage
$87,387
Outstanding Balance
$58,242
Interest Rate
5.25%
Mortgage Type
FHA
Estimated Equity
$247,645
Purchase Details
Closed on
Jan 5, 2010
Sold by
Smith Todd C
Bought by
American General Finl Svcs
Purchase Details
Closed on
Nov 26, 1997
Sold by
Mrc Homes
Bought by
Smith Todd C
Home Financials for this Owner
Home Financials are based on the most recent Mortgage that was taken out on this home.
Original Mortgage
$98,400
Interest Rate
7.38%
Mortgage Type
FHA
Purchase Details
Closed on
Jul 17, 1997
Sold by
Hu-Ka Bldrs
Bought by
Mrc Homes
Home Financials for this Owner
Home Financials are based on the most recent Mortgage that was taken out on this home.
Original Mortgage
$74,336
Interest Rate
7.87%
Mortgage Type
New Conventional
Purchase Details
Closed on
May 18, 1995
Bought by
Hu Ka Builders Inc
Create a Home Valuation Report for This Property
The Home Valuation Report is an in-depth analysis detailing your home's value as well as a comparison with similar homes in the area
Home Values in the Area
Average Home Value in this Area
Purchase History
| Date | Buyer | Sale Price | Title Company |
|---|---|---|---|
| Gaines Kenneth N | -- | -- | |
| Gaines Kenneth N | $89,000 | -- | |
| American General Finl Svcs | $99,000 | -- | |
| Smith Todd C | $98,800 | -- | |
| Mrc Homes | $16,500 | -- | |
| M R C Homes Inc | $16,500 | -- | |
| Hu Ka Builders Inc | -- | -- |
Source: Public Records
Mortgage History
| Date | Status | Borrower | Loan Amount |
|---|---|---|---|
| Open | Gaines Kenneth N | $87,387 | |
| Previous Owner | Smith Todd C | $98,400 | |
| Previous Owner | M R C Homes Inc | $74,336 |
Source: Public Records
Tax History Compared to Growth
Tax History
| Year | Tax Paid | Tax Assessment Tax Assessment Total Assessment is a certain percentage of the fair market value that is determined by local assessors to be the total taxable value of land and additions on the property. | Land | Improvement |
|---|---|---|---|---|
| 2025 | $1,039 | $104,272 | $24,000 | $80,272 |
| 2024 | $651 | $77,270 | $17,200 | $60,070 |
| 2023 | $495 | $77,270 | $17,200 | $60,070 |
| 2022 | $732 | $77,184 | $17,200 | $59,984 |
| 2021 | $792 | $75,184 | $15,200 | $59,984 |
| 2020 | $670 | $66,218 | $12,000 | $54,218 |
| 2019 | $616 | $60,452 | $12,000 | $48,452 |
| 2018 | $557 | $57,130 | $10,600 | $46,530 |
| 2017 | $1,360 | $46,713 | $9,000 | $37,713 |
| 2016 | $368 | $43,300 | $13,000 | $30,300 |
| 2015 | $377 | $44,020 | $13,000 | $31,020 |
| 2014 | $555 | $37,751 | $6,370 | $31,381 |
| 2013 | -- | $35,801 | $6,370 | $29,431 |
Source: Public Records
Map
Nearby Homes
- 724 Manger Ave
- 54 Rowlett Place
- 0 Manger Ave E Unit 20154677
- 0 Manger Ave E Unit 20127001
- 0 Monroe Hwy Unit 7530054
- 0 Monroe Hwy Unit 10466108
- 784 Manger Ave
- 898 Harrison Mill Rd
- 812 Christmas Ave
- 328 Advent Dr
- 203 Nativity Cove
- 203 Nativity Cove Unit LOT 27
- 182 Nativity Cove
- 182 Nativity Cove Unit 30
- 449 & 455 Carl-Bethlehem Rd
- 1050 Bethlehem Church Rd
- 129 Carnaby St
- 220 Carl Bethlehem Rd SW
- 755 Harry McCarty Rd
- 0 Carson Wages Rd Unit 7617509
- 140 Thorn Brook Rd
- 133 Thorn Brook Rd
- 652 Thorn Brook Ridge
- 653 Thorn Brook Ridge
- 144 Thorn Brook Rd
- 145 Thorn Brook Rd
- 148 Thorn Brook Rd
- 655 Thorn Brook Ridge
- 658 Thorn Brook Ridge
- 147 Thorn Brook Rd
- 657 Thorn Brook Ridge
- 150 Thorn Brook Rd Unit 61
- 150 Thorn Brook Rd
- 250 Thorn Brook Cir
- 250 Thorn Brook Cir
- 149 Thorn Brook Rd
- 659 Thorn Brook Ridge
- 252 Thorn Brook Cir
- 51 Gifton Thomas Rd
- 254 Thorn Brook Cir